Branded SEO Reporting: Track & Modernize Insights
If your branded seo reporting still ends at branded clicks, CTR, and rank changes, you're missing part of the market's actual discovery path.
A lot of teams still treat brand visibility as a Google-only problem. That made sense when the main question was whether people searched your company name and clicked your homepage. It doesn't hold up now. Buyers increasingly form impressions in AI answers, local packs, review surfaces, and comparison prompts before they ever visit your site.
The reporting model has to catch up. The old version measured branded demand after it showed up. The better version measures how your brand appears before the click, whether that appearance is consistent, and whether it later turns into branded search, qualified sessions, and conversion activity. That's the shift executives care about. Not more charts. Better evidence.
Beyond Clicks and Rankings Defining Modern Brand KPIs
Branded seo reporting used to be a simpler discipline. Pull branded queries from Google Search Console, compare them with non-branded terms, review CTR and average position, and call it done. That framework is still necessary. It's just no longer sufficient.
The reporting gap is obvious in AI-driven discovery. The Drum argues that reporting needs to expand beyond traffic and clicks to measure presence and consistency in AI-generated answers, then connect that visibility to downstream outcomes like branded search lift and pipeline velocity in its piece on the attribution gap in SEO reporting. That mirrors what many SEO leads are now seeing internally. Search demand can rise after exposure that produced no classic click.
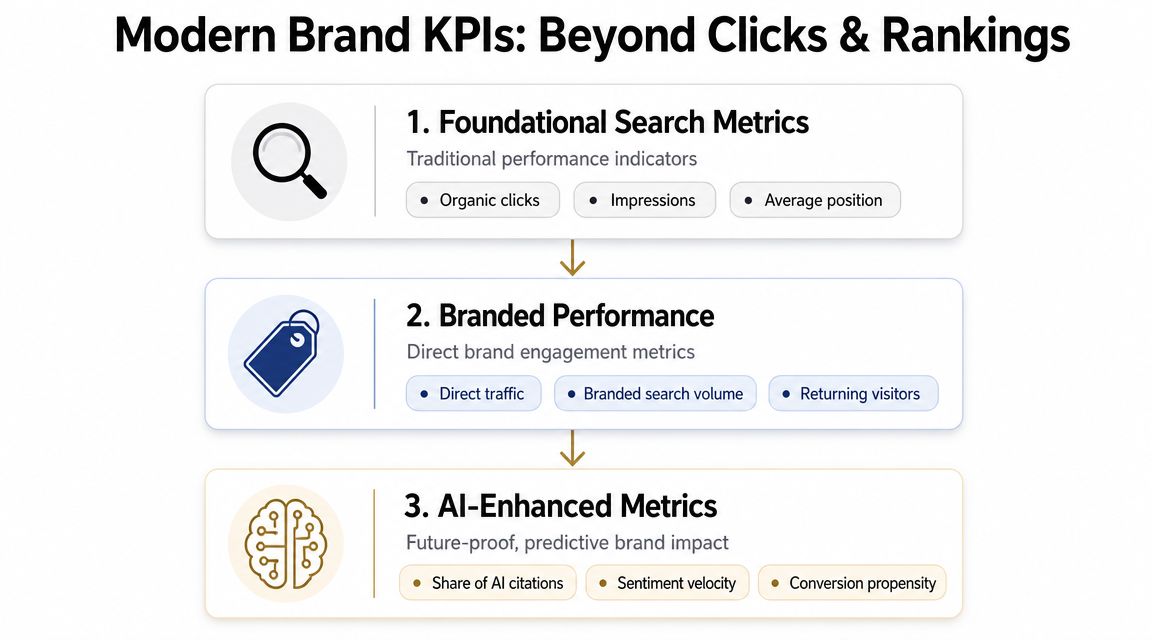
The KPI stack that actually helps
I split modern brand reporting into three layers.
| Layer | What belongs here | Why it matters |
|---|---|---|
| Foundational search metrics | Impressions, clicks, CTR, average position, landing pages | Confirms whether people can find you in classic search |
| Branded performance metrics | Branded vs non-branded query trends, branded landing-page performance, branded conversions | Shows whether brand demand is growing and whether it converts |
| AI-enhanced visibility metrics | Citation presence, link inclusion, relative visibility against competitors, response consistency, brand framing | Captures discovery that happens before or without a click |
That middle layer is where many teams stall. They report demand but don't separate demand creation from demand capture. A clean split between branded and non-branded queries fixes that. If branded impressions rise while generic visibility holds steady, that often signals stronger market awareness, better PR resonance, or improved off-site presence, not just better rankings.
What executives want to see
Executives usually don't care about keyword tables unless those tables explain a business outcome. They want answers to a short list of questions:
- Are more people looking for us by name?
- When they do, do we own the results page cleanly?
- Are AI platforms mentioning us in the right category conversations?
- Is that visibility producing stronger visits, leads, or revenue quality?
That's why I prefer a KPI checklist instead of a giant export.
- Core demand signal: branded impressions and clicks from Search Console
- Quality signal: branded CTR and key branded landing pages
- Commercial signal: conversions, assisted conversions, or qualified lead actions tied back to branded sessions
- AI discovery signal: whether your brand appears in relevant model answers and whether citations point to assets you control
- Reputation signal: whether third-party mentions support or weaken your brand story
Practical rule: If a metric can't help someone decide what to change next month, it probably doesn't belong in the executive summary.
There are also industry-specific cases where this stack matters more. Property brands, for example, often need to connect visibility to channel economics across paid, local, and organic. Teams working through attribution questions there may find real estate marketing ROI tools useful because they force the same discipline executives ask for in SEO reporting: which visibility inputs move business outcomes.
For a more detailed way to think about measurement design, this guide on measuring brand performance in AI and search is worth reviewing alongside your existing reporting framework.
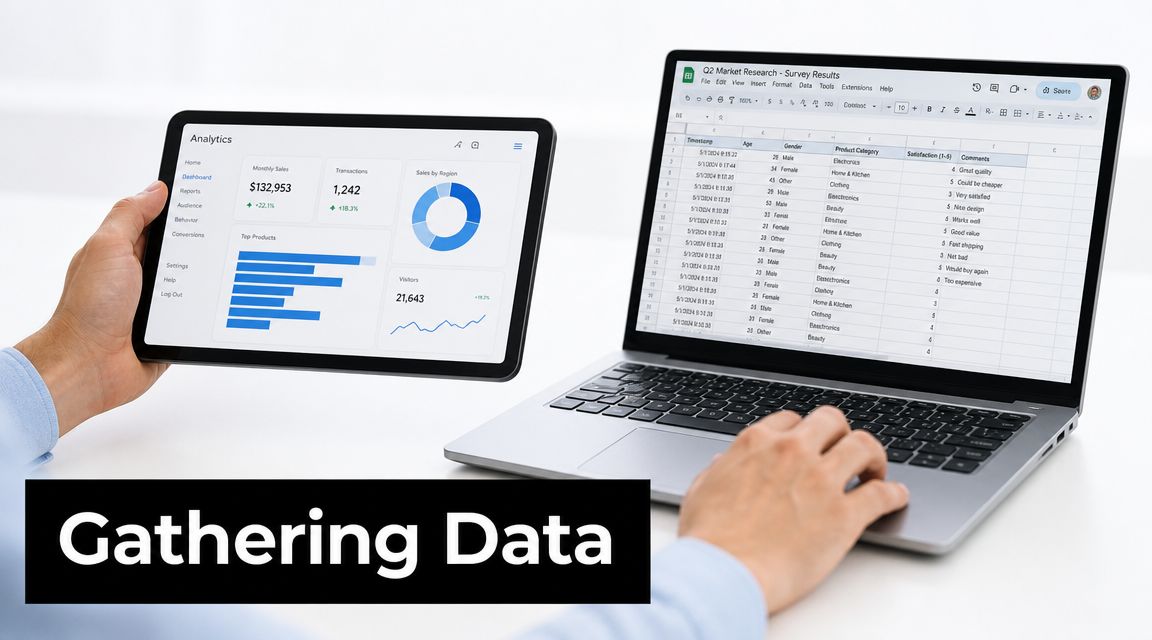
Gathering Your Data Across Search and AI Platforms
How do you build a branded SEO report that explains both branded demand in Google and brand presence inside AI answers, without turning it into three disconnected spreadsheets?
Start with a shared data model. If search data, analytics outcomes, and AI visibility checks use different naming, dates, and segment rules, the report breaks before you design a single chart.
Google Search Console is still the base layer for branded reporting because it gives you query, page, country, and device detail from first-party search demand. The practical lesson from years of using it is simple. Pull branded data at the query level, not from a homepage-only view or a high-level traffic trend. Executives care about whether demand is rising, where that demand resolves, and whether branded interest is turning into qualified activity.
Pull the search data at the query layer
Build branded query filters that reflect how people search for your company, products, and people associated with the brand. Exact-match brand terms are only the starting point.
Include:
- Primary brand terms: company name, product names, abbreviations
- Navigational modifiers: login, pricing, support, docs, reviews, careers, locations
- Misspellings and spacing variants: the fast-typing versions users enter on mobile
- Executive or spokesperson queries: only when those names materially influence discovery or trust
Run a parallel non-branded dataset at the same time. That separation matters because branded demand and category visibility usually move for different reasons. A PR spike, product launch, or offline campaign can lift branded queries without any SEO improvement. Category gains can grow pipeline while branded demand stays flat.
A practical starter structure looks like this:
| Report view | Filter approach | Main use |
|---|---|---|
| Branded query report | Queries containing brand variants | Measures demand capture and branded SERP performance |
| Non-branded query report | Queries excluding brand variants | Measures category reach and new audience discovery |
| Branded page report | Landing pages receiving branded clicks | Shows where branded demand lands and where intent gets resolved |
| Country and device cuts | Segment by market and device | Finds regional gaps, mobile friction, and market-specific brand behavior |
Keep the query rules documented. Otherwise, the same brand report will show different totals each month because someone added a product nickname, removed a misspelling, or changed the regex.
Add business outcome data before you visualize anything
Branded reporting gets misleading fast when Search Console sits in one tab and revenue or lead quality sits somewhere else. Join GA4, CRM, or sales outcome data into the same working layer first.
I usually map branded sessions to a short set of outcomes:
- Primary conversion events such as demos, purchases, calls, or form submissions
- Assisted conversions where branded search appears near the end of the journey
- Lead quality fields such as sales acceptance, pipeline stage, or deal value
Reporting offers greater honesty. If branded clicks are up because a campaign drove curiosity, but lead quality dropped, the executive takeaway is not "brand SEO improved." The takeaway is that awareness rose faster than commercial intent, or that the landing experience is attracting weaker-fit traffic.
Treat AI visibility as a tracked dataset, not a screenshot exercise
AI search adds a new reporting problem. Your brand can influence the answer without earning a click, and your brand can be mentioned even when your own site is not the cited source. Legacy branded SEO reporting misses both.
The fix is a prompt library with version control, recurring runs, and fixed competitors. That gives you a repeatable way to measure whether your brand appears in model answers, which domains get cited, how often owned assets are referenced, and where competitor brands displace you. If you need a process for setting this up, this guide to AI visibility tracking across search models is a good operational reference.
A useful prompt set usually includes:
- Category prompts: best tools, best providers, top software, leading agencies
- Comparison prompts: your brand vs direct competitors
- Use-case prompts: best option for a team size, region, workflow, or budget
- Trust prompts: reviews, complaints, reliability, alternatives
- Decision-stage prompts: what to shortlist, who should buy, when to switch
Keep the prompts close to real buying language. Polished internal phrasing often produces cleaner outputs but worse reporting because customers do not search or prompt that way. Teams that want to improve prompt construction can use this guide on advanced AI prompting for SEO.
Standardize the fields before you merge the sources
Search Console, GA4, CRM exports, and AI visibility logs rarely line up on their own. Set shared dimensions before the data hits a dashboard.
Use a simple schema:
- Date
- Market or country
- Device
- Brand segment such as branded or non-branded
- Query or prompt theme
- Landing page or cited URL
- Outcome metric such as conversion, assisted conversion, or pipeline status
- Visibility type such as search click, AI mention, AI citation, competitor citation
This is the difference between a report you can trust and a report that needs manual cleanup every month.
I also recommend storing AI observations at two levels. Log the prompt-level result for detailed analysis, then roll it up into themes like comparisons, alternatives, and trust questions. Executives do not need every prompt. They do need to know that your brand is strong in navigational search, weak in AI comparison prompts, and under-cited in high-intent recommendation queries.
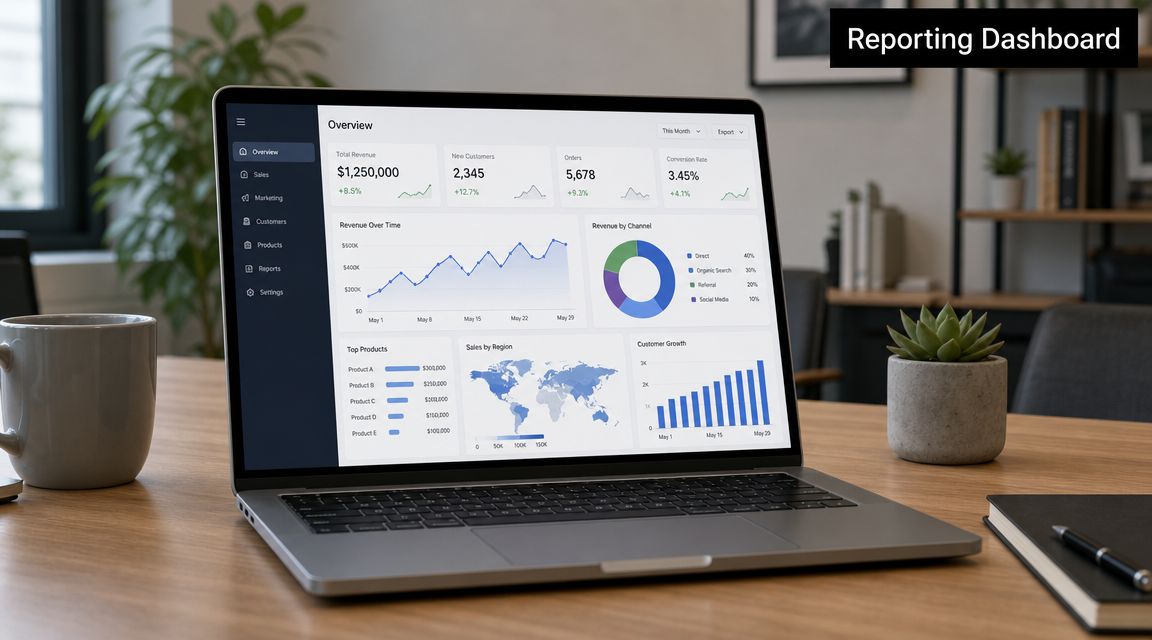
Designing Your Unified Branded Reporting Dashboard
Most branded reports fail for one reason. They mix everything together and force the reader to do the interpretation.
A useful dashboard separates signals by job. Search Console handles classic demand and page performance. Analytics or CRM data handles outcome validation. AI visibility tracking handles discovery surfaces where your brand may appear without a click. Once those roles are clear, the dashboard almost designs itself.
The four-module dashboard layout
I like a single-screen executive view with drill-down tabs behind it. The front page should answer what changed, why it changed, and what needs action.
Use four modules.
| Module | What to include | What to avoid |
|---|---|---|
| Brand search health | Branded impressions, clicks, CTR, average position, top branded landing pages | Giant keyword dumps |
| AI visibility scorecard | Prompt coverage, citation presence, source patterns, competitor mentions | One-off screenshots with no repeatable method |
| Business impact | Conversions, assisted conversions, lead quality notes, revenue linkage where available | Traffic charts with no commercial context |
| Competitive snapshot | Relative brand presence in search and AI answer sets | Broad competitor lists nobody acts on |
This structure aligns with practical reporting guidance from Search Engine Land, which recommends separating branded and non-branded demand at the query layer on a monthly cadence, then pairing those trends with conversion and revenue data so reporting moves beyond vanity metrics in its SEO reporting guide.
What the executive page should look like
The summary row needs restraint. If you crowd it, nobody reads it.
Use a compact headline area like this:
- Brand demand trend: a short note on whether branded query visibility moved up, down, or stayed flat
- AI answer presence: whether your brand appeared more consistently in priority prompts
- Conversion quality check: whether traffic quality matched visibility growth
- Primary risk: one issue, such as weak CTR on branded pages or poor citation control
Then add annotated charts below. Annotation matters. A simple line graph becomes executive-ready when you mark the product launch, PR wave, content release, review surge, or technical issue that likely influenced the change.
A lot of teams also benefit from reviewing examples of broader reporting stack design before building this in Looker Studio or a BI tool. This overview of marketing intelligence platforms is useful because it shows how multiple data sources can live in one decision layer rather than in separate tool silos.
A simple page order that works
If you're building from scratch, this sequence usually keeps the report readable:
- Executive summary
- Brand search health
- AI visibility and source analysis
- Conversion and pipeline impact
- Competitive movement
- Actions for next period
One more thing helps here. Show examples, not just definitions.
After the dashboard is live, resist the urge to keep adding modules. Most bloated reports are just unedited reports.
The best branded dashboard is opinionated. It highlights what changed and leaves supporting detail in drill-down tabs.
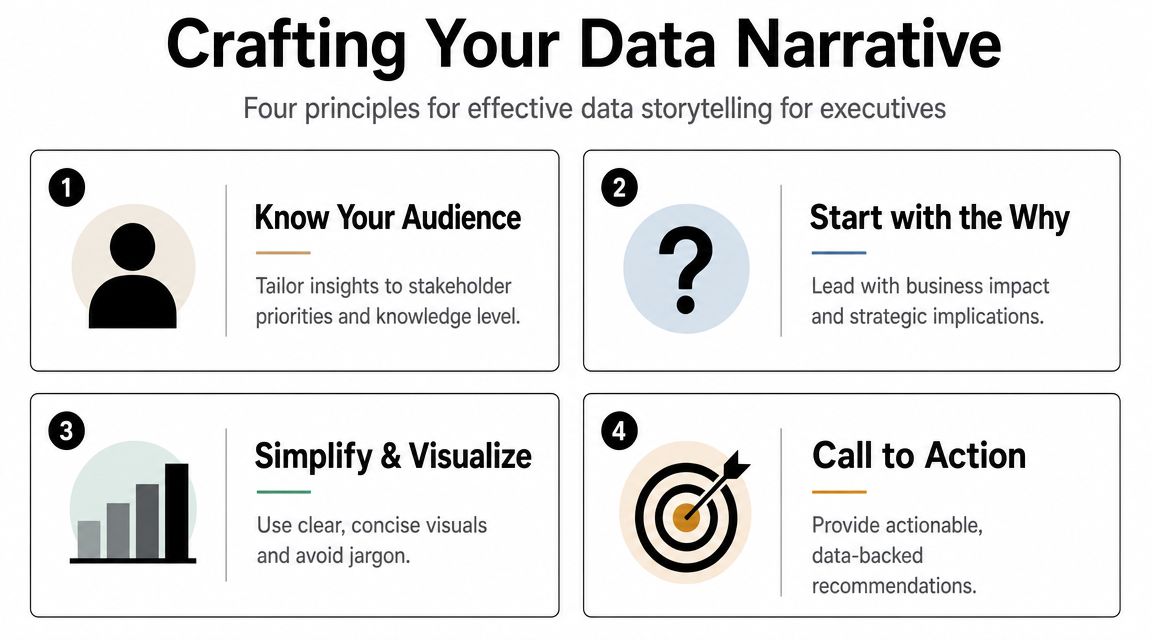
Crafting a Narrative for Stakeholders and Executives
Raw data rarely changes budget decisions. A clear narrative does.
I've seen the same dashboard land in two very different ways depending on the write-up attached to it. Version one says branded impressions rose, AI mentions improved, and several pages performed well. Everyone nods, then moves on. Version two explains where visibility improved, what likely caused it, and what action should follow. That's the version leadership remembers.
A before and after example
Here is the weak version:
Branded traffic improved this month. AI visibility also improved. Top pages performed well and overall SEO remained positive.
That language says almost nothing. It avoids trade-offs, removes accountability, and gives no next move.
Now compare it with a stronger executive summary:
Branded demand strengthened in priority markets, and branded landing pages held visibility. AI answers also referenced the brand more often in category and comparison prompts. The gain appears to be concentrated around a small set of sources and pages, which is positive for momentum but risky for resilience. The next priority is to expand source diversity and improve branded page messaging so discovery translates into more qualified conversions.
Same broad situation. Better interpretation.
Use an observation insight action format
The easiest reporting narrative is still the most effective.
- Observation: state the change plainly
- Insight: explain the likely driver or implication
- Action: recommend what the team should do next
Here's how that sounds in practice:
- Observation: Branded query visibility improved while non-branded demand stayed comparatively steady.
- Insight: Brand awareness likely moved faster than category reach, so some of the lift is probably coming from off-site activity, direct demand, or AI answer exposure rather than from broad generic ranking gains.
- Action: Protect branded SERP ownership, expand high-trust citations, and tighten branded page messaging to improve conversion efficiency.
What to cut from your commentary
Executives don't need every metric. They need confidence that the team knows what matters.
Avoid these habits:
| Weak habit | Better alternative |
|---|---|
| Reporting every ranking movement | Focus on material shifts in branded demand and business impact |
| Listing metrics with no judgment | Add interpretation and next action |
| Hiding uncertainty | State where attribution is directional rather than exact |
| Using SEO jargon | Translate into visibility, demand, conversion, and risk |
Modern SEO reporting has moved this way for a reason. Guidance summarized by We Are TG notes that effective reports combine organic traffic, conversions, top-performing pages, and recommended next actions, pushing reporting away from isolated keyword tables and toward performance narratives that connect demand to business outcomes in its article on better SEO reporting.
A good monthly report doesn't prove that SEO exists. It helps leadership decide what to fund, fix, or scale.
When teams get the narrative right, branded seo reporting stops being a recap. It becomes a steering mechanism.
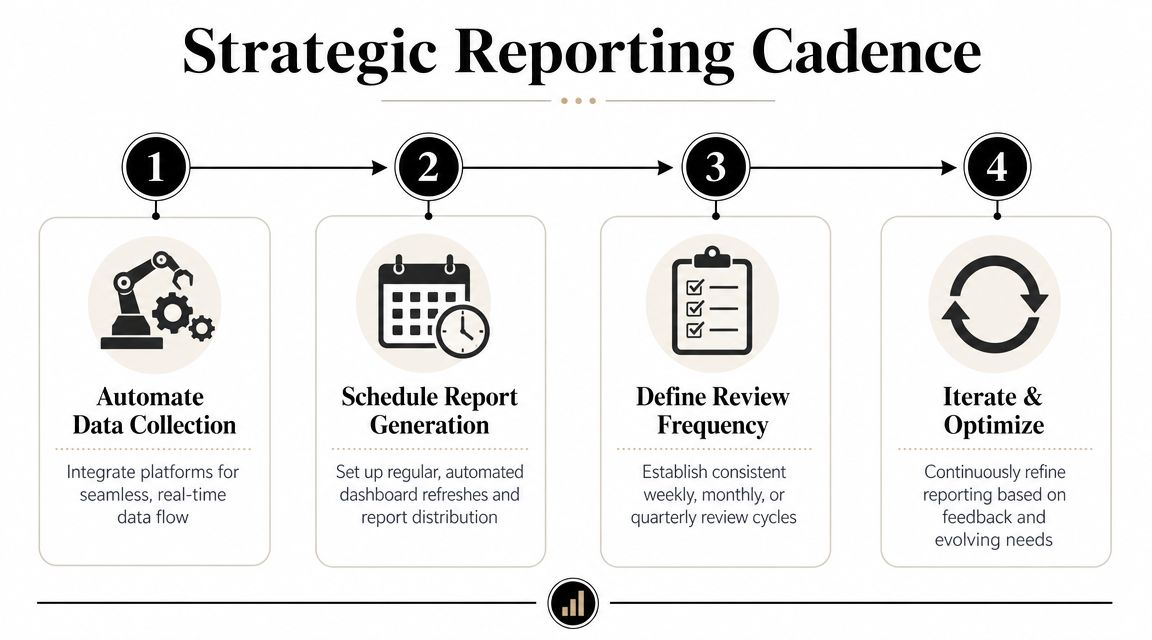
Automating Reports and Establishing a Strategic Cadence
How do you keep branded SEO reporting useful once it includes Search Console, analytics, CRM signals, and AI visibility across multiple models?
The answer is a reporting system with clear ownership, fixed refresh rules, and a review cadence that matches the decision being made. Legacy branded reporting could survive on manual exports because the scope was narrow. Once you add prompt-level brand visibility, source citations, sentiment shifts, and competitor presence in AI answers, manual reporting becomes slow and inconsistent.
The cadence I trust most
I use three reporting layers.
- Weekly team snapshot: catch branded SERP ownership issues, AI visibility drops, citation changes, and tracking anomalies before they affect a monthly readout
- Monthly leadership report: show trend movement, conversion impact, risk, and the next actions that need budget or cross-functional support
- Quarterly strategic review: revisit KPI definitions, prompt sets, competitor groups, market changes, and whether the dashboard still reflects how people discover the brand
That structure keeps the work honest. Weekly reviews are for diagnosis. Monthly reviews are for decisions. Quarterly reviews are for changing the reporting model itself.
What to automate
Automate anything repetitive, time-bound, and easy to verify.
- Data refreshes: Search Console, analytics, CRM connectors, and AI visibility feeds
- Entity matching and tagging: branded query groups, brand variants, product names, and tracked prompt categories
- Scheduled delivery: dashboards, PDFs, Slack summaries, or email digests on a fixed schedule
- Alerting: CTR drops on branded pages, lost FAQ or review ownership, competitor gains in tracked prompts, or sudden citation loss in AI answers
If the monitoring layer is still manual, the reporting layer will stay fragile. This guide to an automated rank tracker for recurring visibility checks is a practical reference for setting up dependable refresh cycles and exception-based reviews.
What should stay manual
Do not automate judgment.
Keep these parts human:
- Attribution calls
- Executive commentary
- Risk prioritization
- Action planning
- Trade-off decisions between brand protection, content expansion, and technical fixes
This is usually where reporting breaks. Teams automate collection, then let templated commentary fill the gap. Executives get a neat dashboard with no clear point of view. A better approach is to automate the inputs and write the commentary around three questions: What changed, why does it matter, and what do we do next?
A simple operating rule helps. If a metric can trigger an alert, automate it. If it changes budget, messaging, or roadmap priority, review it manually.
The right cadence saves time, but that is not the main benefit. It gives the SEO team and leadership a shared rhythm for reviewing brand demand, SERP control, and AI answer visibility before a small visibility loss turns into a bigger revenue or reputation problem.
If your team needs a clearer view of how AI platforms present your brand, promptposition gives you a practical way to track visibility, sentiment, sources, and competitor positioning across major models so your branded seo reporting reflects how discovery happens now.