The New Rules for Measuring Digital Marketing Effectiveness
Measuring digital marketing effectiveness has always been about connecting actions to real business outcomes. It’s how you prove your campaigns are driving revenue, not just clicks. But the rulebook is being rewritten. Today, success means mastering the traditional metrics while also measuring your brand's influence in a new, powerful arena: AI-generated answers.
This guide will walk you through the evolution of marketing measurement, covering the essential KPIs you already know and introducing the emerging metrics you need to master for the age of AI.
How Marketing Measurement Is Evolving Beyond Clicks and Conversions
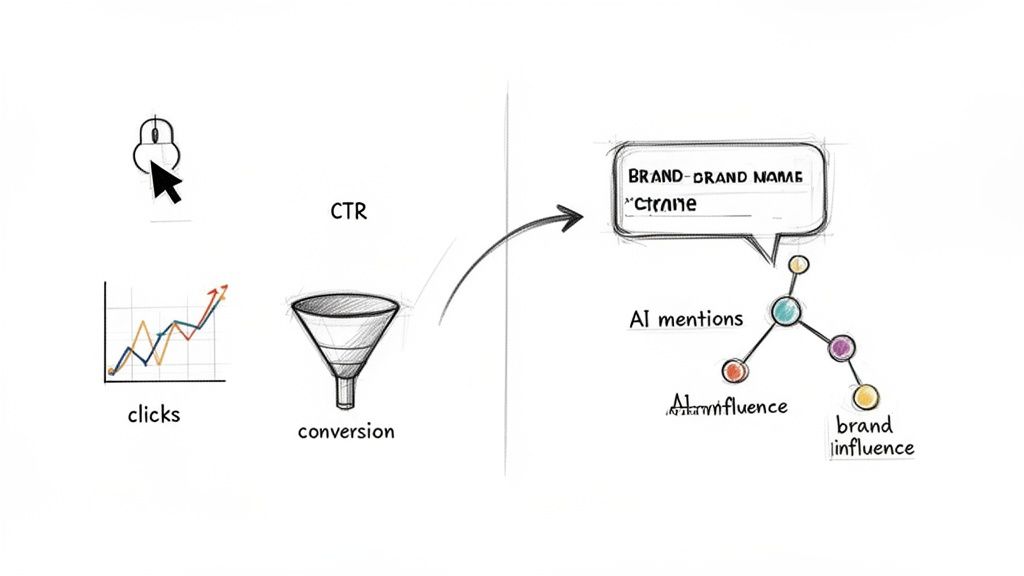
Not long ago, measuring marketing effectiveness felt straightforward. We tracked website traffic, click-through rates (CTR), and conversions, and that was enough to prove our value. While those metrics remain the foundation of any good analysis, they no longer capture the full picture. The way people find information is undergoing a fundamental shift.
Generative AI tools like ChatGPT, Gemini, and Perplexity have emerged as powerful new gatekeepers between your brand and your audience. This changes everything.
The New Dimension: Visibility in AI-Generated Answers
Today, effective marketing isn’t just about winning a click to your website. It’s about influencing how your brand appears in the AI-generated answers millions of people now trust. When a potential customer asks an AI for "the best CRM for a small business," the response they get is their new first impression of the market. If you're not mentioned, you're invisible.
This creates a massive blind spot for marketers who rely solely on traditional dashboards. Your website traffic might look healthy, but if AI models are recommending a competitor or surfacing outdated, negative information about your product, you are losing customers before they even reach your funnel. You can dig deeper into this idea in our guide on new search metrics for SEO visibility.
The modern challenge is measuring influence in a world where the most important touchpoint might not be a click, but a mention within an AI conversation. This is the evolution from direct-response measurement to brand presence analytics.
From Traditional KPIs to an AI-Augmented View
To measure marketing effectiveness accurately today, you must expand your view to include metrics built for this new reality. This doesn't mean discarding what works; it means augmenting it.
Here are the emerging metrics you need to add to your stack:
- AI Visibility Rate: What percentage of relevant AI-generated answers mention your brand?
- Sentiment Score: When you are mentioned, is the tone positive, neutral, or negative?
- Position in LLM Responses: Are you the first recommendation in an AI's list, or an afterthought buried at the bottom?
The good news is that integrating these insights is simpler than you might think. You don't need to overhaul your entire measurement system. Tools like PromptPosition are designed to act as an additional data source that plugs into your existing workflow. Think of it as adding a specialized data feed, much like how you use Google Analytics for web behavior. By adding these insights, you get a much more complete and predictive view of your marketing's true effectiveness, finally connecting your brand’s perception in AI to the bottom-line results you’re already tracking.
Mastering Your Foundation with Traditional KPIs
Before diving deeper into AI-powered analytics, it's crucial to master the fundamentals. Every effective marketing strategy is built on a solid foundation of traditional Key Performance Indicators (KPIs). These are the numbers that tell the story of your performance, showing you what’s working and what isn’t.
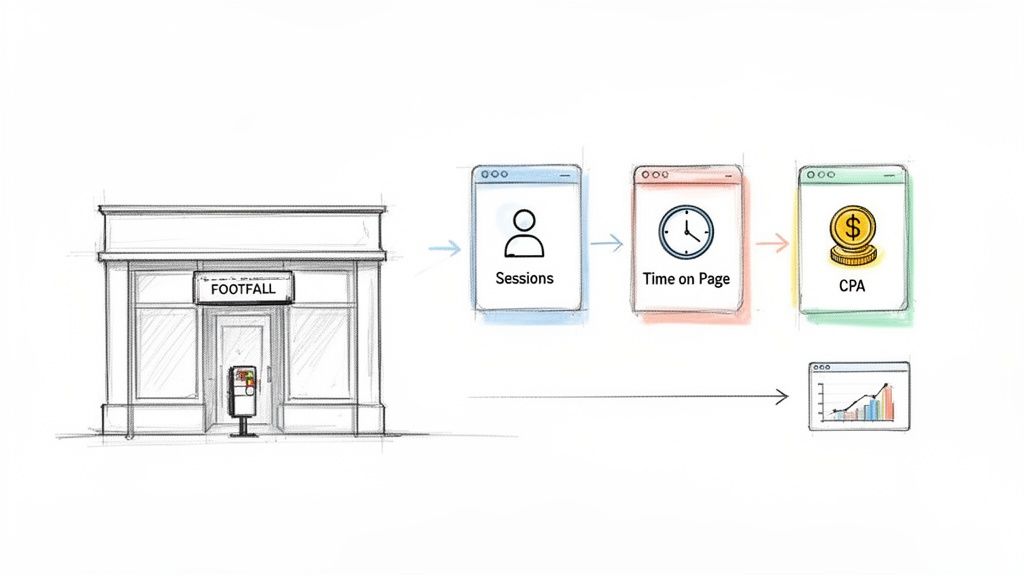
The easiest way to think about this is to imagine your website is a physical store. The most important KPIs are simply digital translations of what you’d measure in the real world: foot traffic, customer behavior, and sales.
Traffic and Engagement Metrics
This first set of metrics is like having a doorman counting everyone who walks in and noticing how long they stick around. These are your top-of-funnel signals, telling you if your ads and content are actually getting people through the door.
- Sessions and Users: This is your digital foot traffic. Sessions count the total number of visits your site gets, while Users track the unique individuals behind those visits. If you see a lot of sessions from a smaller number of users, it's a great sign of repeat business and brand loyalty.
- Time on Page and Bounce Rate: Once people are in your "store," are they actually browsing? Time on Page tells you how long they engage with your content. Bounce Rate, on the other hand, shows the percentage of people who walk in, take one look, and immediately leave. A high bounce rate is a red flag, often pointing to a disconnect between your ad and your landing page.
By keeping a close eye on these numbers, you get a clear picture of your audience size and initial interest. It's the first and fastest way to know if your campaigns are grabbing attention.
Conversion Performance Metrics
Getting people in the door is just the start. The next, more important step is guiding them to take action. These conversion metrics track the real outcomes that grow your business, moving beyond simple interest to measure intent.
Conversion metrics are the cash registers of your digital marketing. They don't just measure interest; they measure intent and action, turning anonymous visitors into tangible leads and customers.
Here are the conversion KPIs that truly matter:
- Conversion Rate: This is the big one—the percentage of visitors who do what you want them to do, whether it’s filling out a form, signing up for a newsletter, or buying a product. It's a direct measure of how persuasive your website and your offer are.
- Cost Per Acquisition (CPA): Your CPA tells you exactly how much you're spending to get one new customer. This metric ties your marketing budget directly to results, helping you figure out which campaigns are actually profitable.
- Lead Quality: Not all leads are created equal. A "conversion" from someone who will never buy isn't worth much. Tracking the handoff from Marketing Qualified Leads (MQLs) to Sales Qualified Leads (SQLs) helps you make sure you’re not just generating volume, but attracting people who are genuinely ready to become customers.
Revenue Impact Metrics
Finally, we get to the numbers that connect everything you do to the bottom line. These are the KPIs your leadership team cares about because they prove marketing is a revenue-generating engine, not just a cost center. For some industries, specialized Real Estate Marketing ROI Tools can offer deeper insights for a more precise assessment.
The most important revenue metric is Return on Ad Spend (ROAS), which calculates the total revenue generated for every dollar spent on advertising. For example, a ROAS of 3:1 means you earned $3 for every $1 you spent. This KPI is the ultimate measure of campaign profitability and effectiveness, directly tying your marketing efforts to financial success.
Measuring Brand Performance in the New Era of AI Search
If you're only looking at traditional KPIs like traffic and clicks, your analytics are missing a huge piece of the story. A massive shift is happening right now, completely off the radar of tools like Google Analytics. Millions of people are starting their research not on Google, but by asking questions of AI models like ChatGPT and Gemini.
Think of these AI tools as a new kind of digital consultant. When a potential customer asks, "What's the best accounting software for freelancers?" the AI's answer forms their initial shortlist. If your brand isn't mentioned, you’ve lost a potential customer before you even knew they existed. This means we have to evolve our thinking. It's no longer just about measuring traffic; it's about measuring influence.
The Emerging Metrics for AI Visibility
To get a real handle on performance today, we need to look beyond our standard dashboards. This isn't about replacing your current metrics, but enriching them with a new layer of insight that shows how your brand is perceived where modern discovery begins.
Here are the essential AI-centric KPIs your team needs to start tracking:
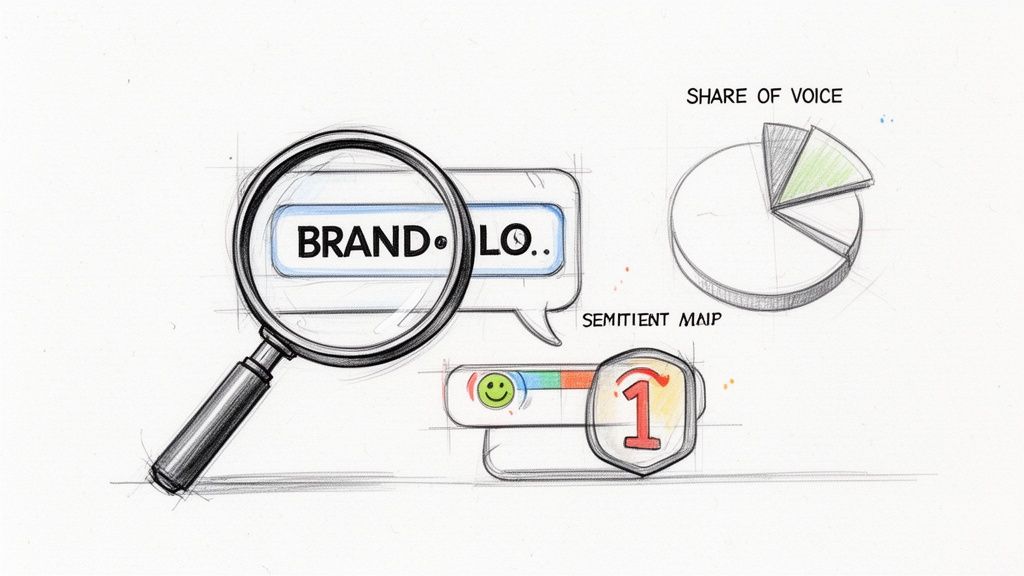
- AI Visibility Rate: This is the most fundamental question: Are you even part of the conversation? This metric measures the percentage of relevant prompts where an AI mentions your brand. A low score here is a major red flag.
- Share of Voice in AI: It's not enough to just show up; you need to know how you stack up. This metric benchmarks your visibility against your direct competitors. If your top rival is mentioned in 70% of AI answers and you're only at 20%, you have a serious awareness gap to close. You can learn more about how to calculate your Share of Voice in our detailed guide.
- Sentiment Score: This digs into the context of the mention. Is your brand recommended enthusiastically, listed neutrally, or—worst of all—criticized? Negative sentiment can be more damaging than being invisible.
- Position in LLM Responses: When an AI lists multiple brands, order matters. Just like with classic search results, being the first recommendation carries the most weight. This KPI tracks where you appear in the list, giving you a sense of your perceived authority.
The way we measure marketing goals is changing. What worked for a decade of keyword-driven search needs an update for a world of conversational AI. The table below shows how traditional metrics are evolving.
Traditional vs. AI-Driven Marketing Metrics
| Measurement Goal | Traditional KPI (e.g., Google Search) | Emerging AI KPI (e.g., ChatGPT, Gemini) |
|---|---|---|
| Brand Awareness | Search Impressions, Share of Voice (SOV) | AI Visibility Rate, Share of Voice in AI |
| Audience Engagement | Click-Through Rate (CTR), Time on Page | Sentiment Score, Context of Mention |
| Competitive Positioning | Keyword Rankings (Position 1-10) | Position in LLM Responses (Position 1, 2, 3) |
| Lead Generation | Form Fills, Clicks on "Contact Us" | Favorable Mentions in "Best of" Prompts |
| Product Consideration | Clicks on Product/Comparison Pages | Inclusion in AI-Generated Comparisons |
As you can see, the core goals remain the same—we still want awareness and consideration. But the signals we need to measure have shifted from clicks and impressions to mentions and sentiment within AI conversations.
The Invisible Influence on Purchase Decisions
Here’s the part that keeps smart marketers up at night: the impact of these AI interactions is often silent. A user might not click a single link in the AI's response, meaning no traffic is ever recorded in your analytics. But the seed of a decision has been planted.
Imagine a user asks, "Is Brand X or Brand Y better for project management?" The AI might reply, "While both are good options, Brand Y is often praised for its intuitive user interface and superior customer support."
Even if that person later goes to Google and searches directly for "Brand Y," their perception is already biased. They arrive on your site with a preconceived notion shaped by the AI, making the job of your marketing funnel infinitely easier. This is a conversion driver that traditional dashboards will never catch.
Measuring digital marketing effectiveness today requires you to track the conversations happening about your brand in AI, not just the traffic coming to your brand from traditional search.
This is precisely where tools designed for this new reality, like PromptPosition, come into play. It plugs this blind spot, acting as a new data source that feeds directly into your measurement strategy. It gives you clear, actionable data on your AI visibility, sentiment, and competitive standing, allowing you to add these crucial metrics to your dashboards without throwing out the systems your team already relies on.
Integrating AI Metrics into Your Current Workflow
Bringing new metrics into your measurement plan can feel overwhelming. The last thing you want is to tear down an entire analytics setup that your team knows and relies on. The good news is you don’t have to. You can weave these new AI insights directly into your current marketing stack without causing chaos.
Think of it like adding a new, specialized instrument to an orchestra. Your existing tools—Google Analytics, your CRM, your data visualization platform—are already playing their parts beautifully. AI analytics just adds another layer that gives the performance a richer, more complete sound.
Add a New Data Source, Not a New System
The key is to treat AI analytics as just another data source. It’s not here to replace Google Analytics or your CRM; it’s designed to augment them with a critical new layer of information about how you’re showing up in generative AI.
This is where a dedicated tool becomes essential. A platform like PromptPosition is built to act as a seamless data plug-in. It constantly monitors how your brand is represented in AI conversations and then feeds that information back to you in a structured, usable format. This lets you pull AI visibility data directly into the dashboards you already live in every day.
For example, this dashboard from PromptPosition tracks a brand's visibility and sentiment within AI models over time.
A visual like this immediately turns an abstract concept like "AI visibility" into a concrete KPI. You can track it, benchmark it, and act on it, just like any other marketing metric.
Connecting the Dots for a Complete Performance Picture
The real magic happens when you start connecting these new AI metrics to your traditional KPIs. When you layer AI visibility data on top of your existing analytics, you can finally uncover the hidden correlations that explain sudden shifts in performance.
Imagine a scenario we’ve all faced: your organic traffic suddenly flattens out. Your SEO team checks everything. Rankings are stable, the site's technical health is perfect, and backlink velocity hasn't changed. By all traditional measures, things should be looking up. But what if the problem isn't on Google's search results page at all?
Integrating AI data allows you to diagnose problems that are invisible to traditional analytics. A sudden drop in AI visibility can act as a leading indicator, explaining a subsequent slump in traffic or conversions that would otherwise be a mystery.
By adding AI data to your measurement stack, you might discover one of these all-too-common issues:
- A Competitor Takeover: A rival just launched a savvy campaign that resulted in them being favorably mentioned in 60% of relevant AI answers, effectively pushing your brand out of the conversation.
- A Negative Sentiment Spike: A misleading article was published, and now AI models are citing it as a source, causing negative sentiment around your brand to jump.
- Shifting AI Source Material: The LLM updated its knowledge base and now relies on a new set of sources where your brand isn't well-represented.
Without this data, you're left guessing. With it, you can pinpoint the exact cause and take targeted action. You can learn more about turning these insights into strategy with modern marketing intelligence platforms.
How to Integrate AI Data into Your Dashboards
Making this data actionable is more straightforward than you might think. The goal is to bring all your key information into a single pane of glass, whether you use Looker Studio, Tableau, or another BI tool.
- Collect Your AI Data: Use a platform like PromptPosition to automatically monitor your AI visibility, sentiment, and share of voice. Most modern tools offer API access for automated data pulls, which is ideal.
- Combine Data Sources: In your dashboarding tool, create a blended data source. This is where you'll combine your web analytics (traffic, conversions) with your new AI analytics data.
- Visualize Correlations: Create charts that plot traditional and AI metrics on the same timeline. For instance, you could graph your organic traffic against your AI Visibility Rate to see how they influence each other.
This integrated approach transforms your reporting from a simple "what happened" summary into a powerful diagnostic tool. It gives you a much richer, more complete picture of your performance and helps you finally explain why your metrics are changing—all without disrupting the workflows your team already relies on.
Building a Holistic Measurement and Reporting Plan
We've covered the classic KPIs that anchor your marketing and the new AI metrics that show you what’s next. Now, let’s get practical and weave them together into a single, cohesive measurement plan. The goal here isn't to add more tasks to your plate; it's to make every action you take more deliberate and tied directly to a business outcome.
A truly effective plan gives you a complete picture of your performance. It tells you what’s happening on your website, but just as importantly, it reveals what’s being said about your brand in the AI-driven conversations that influence customers long before they ever think about clicking "buy."
From Goals to KPIs: The Right Mix
The starting point is always the same: your business objectives. Before you even think about picking metrics, you need to be crystal clear on what you're trying to achieve. Whether you're aiming to grow market share, land more enterprise leads, or drive product adoption, you work backward from that goal to select the right KPIs.
This is where you blend the foundational metrics with the forward-looking ones.
For a goal like "Increase Market Share":
- Traditional KPIs: You'll watch your Sessions, New Users, and branded search volume to gauge audience growth.
- AI KPIs: At the same time, you'll monitor your AI Visibility Rate and Share of Voice in AI to see if you're actually gaining ground on competitors in this new arena.
For a goal like "Improve Brand Perception":
- Traditional KPIs: You might look at social media sentiment and an uptick in direct traffic, which can signal positive brand recall.
- AI KPIs: You’ll also measure your Sentiment Score across different AI models to get an unfiltered look at how your brand is actually being portrayed.
With this approach, every metric on your dashboard has a real job to do. It stops being just a number and becomes a progress bar tracking you toward a meaningful business goal.
Choosing Your Toolset for a Unified View
To get that complete picture, you need tools that provide both foundational web data and forward-looking AI insights. Giving your team the best tools for digital marketers is crucial for making sense of this new environment.
Think of your tool stack as having distinct jobs:
- Web & Conversion Analytics: Google Analytics 4 is still the gold standard for understanding what users do once they land on your site.
- AI Search Analytics: This is where a specialized platform like PromptPosition comes in. It’s essential for tracking how your brand shows up in AI-generated answers, acting as a unique data source that reveals your visibility, sentiment, and competitive standing in models like Gemini and ChatGPT.
This simple workflow shows how you can pull this new AI data into your existing process, moving from raw data collection to actionable analysis.
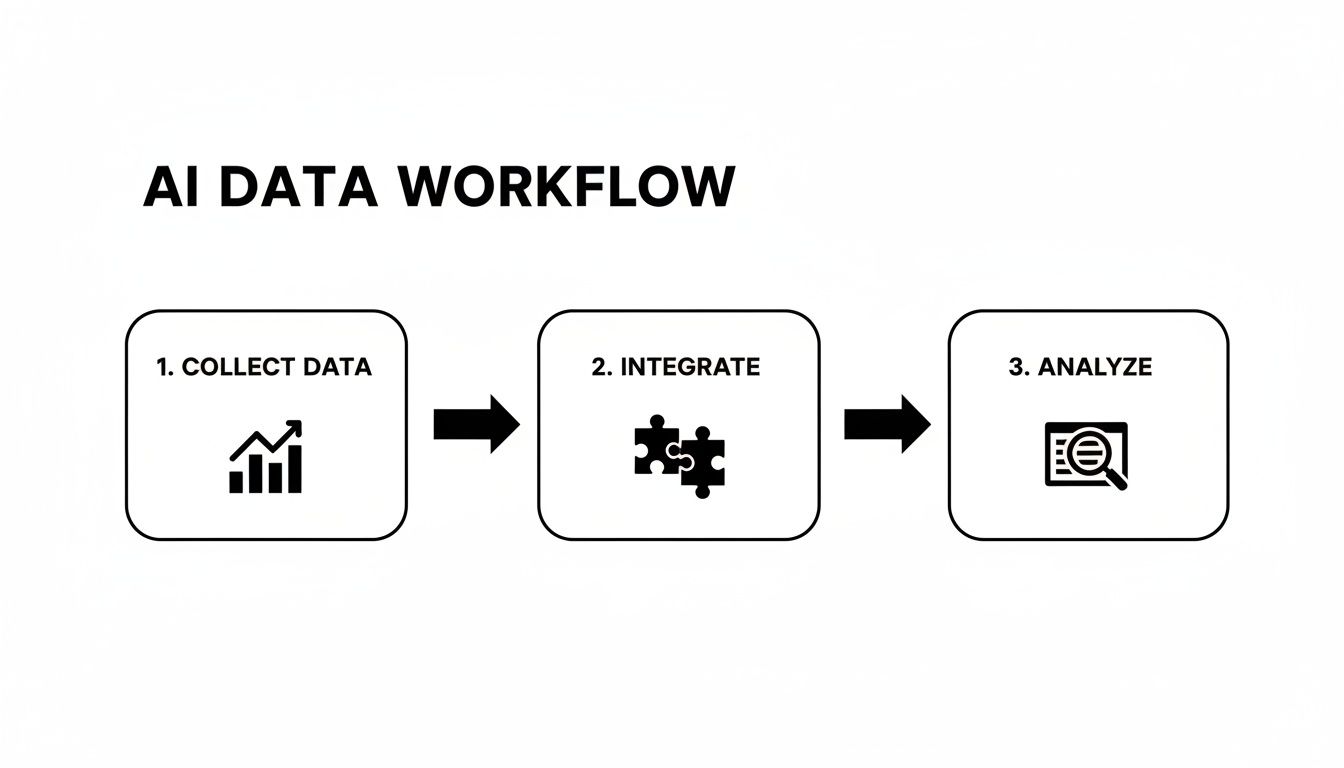
Here, you see how specialized AI data is first collected, then blended with your existing analytics, and finally analyzed to create a complete performance picture.
Turning Insight into Action: A Case Study
Let's put this into a real-world context. Imagine a brand manager, Sarah, is doing her monthly review. Her traditional metrics look pretty good—organic traffic is up 5%, and her conversion rate is holding steady. But when she pulls up her AI visibility data in PromptPosition, she finds a hidden problem.
Her top competitor is mentioned positively in 70% of AI-generated answers related to their main product category, while her brand only appears in 15% of them. Digging deeper, PromptPosition shows her that Gemini is citing a negative, year-old review when describing her product. Suddenly, the feeling that their market share has been stagnating, despite decent traffic, makes perfect sense.
Without this complete view, Sarah would have been celebrating a small traffic bump while her brand was quietly losing ground in a critical new channel. The integrated data transformed a hidden threat into a clear, actionable opportunity.
Armed with this specific insight, Sarah's team springs into action. They launch a targeted content and PR push to amplify newer, positive reviews and publish articles that directly address the outdated criticism. All the while, they use PromptPosition to track the impact, watching as their brand’s sentiment score improves and their visibility rate climbs. This is what a modern reporting plan looks like in practice—turning data directly into strategy. To build your own effective reports, it can be helpful to study different kinds of search ranking reports and adapt them to your needs.
Frequently Asked Questions About Measuring Marketing Effectiveness
Whenever we talk about adding a new layer to our marketing measurement—especially something as new as AI visibility—a lot of practical questions come up. It's only natural. How do you start without a huge budget? Do your old KPIs still matter? And how do you convince your boss this is worth the effort?
Let's get straight to the answers for these common hurdles. The goal here is to give you the confidence to get started, armed with real-world solutions.
How Can I Start Measuring AI Visibility on a Limited Budget?
Good news: you don't need a massive budget to get going. The most important first step is simply to start looking. If you're working with limited funds, you can kick things off with a focused, manual approach that costs nothing but a bit of your time.
- Start Small and Document Everything: Pick 10-15 of your most important brand and product-related prompts. Run them weekly in major AI models like ChatGPT and Gemini and log what you find.
- Track Key Questions in a Spreadsheet:
- Did our brand show up in the answer?
- Was the mention positive, neutral, or negative?
- Which of our competitors got mentioned when we didn't?
This hands-on tracking isn't a long-term solution, of course. But it’s an incredibly effective way to build an initial business case. It gives you concrete, early-stage insights into your brand's standing in these new search environments. These initial findings are often exactly what you need to justify investing in a dedicated tool like PromptPosition, which can automate the work and deliver scalable, historical data.
Are Traditional KPIs Like Traffic and Conversions Now Obsolete?
Absolutely not. It's a common worry that new metrics make old ones irrelevant, but the reality is they work best together, each telling a different part of the story.
Traditional KPIs are the bedrock of performance. They tell you if your marketing is driving action and revenue today. AI metrics are a leading indicator, giving you a glimpse into your brand health and performance tomorrow.
Think of it this way: metrics like website traffic, conversion rates, and ROAS are your immediate feedback loop. They tell you if your campaigns are profitable right now. They're non-negotiable.
AI visibility metrics, however, add crucial context. A slow decline in your AI sentiment score this quarter could be the invisible force that causes a drop in your conversion rate next quarter. The smartest measurement strategies combine both data sets to understand what’s happening now and anticipate what’s coming next.
How Do I Convince My Leadership to Invest in Measuring AI Search?
Getting buy-in for a new measurement area usually comes down to how you frame the conversation. Don't pitch it as a new cost. Instead, present it as a strategic imperative for managing risk and seizing a massive opportunity.
The risk is simple: becoming invisible on what is rapidly becoming a primary channel for discovery and information. Show your leadership hard data on AI adoption and, more importantly, show them specific examples where your direct competitors are already being recommended by models like Gemini. This makes the threat to your market share feel immediate and real.
The opportunity is to gain a powerful first-mover advantage.
- Gather Preliminary Data: Use a tool like PromptPosition to run a quick, initial analysis of your brand’s current visibility.
- Highlight Gaps and Issues: Present concrete screenshots showing where you have visibility gaps, suffer from negative sentiment, or are being outmaneuvered by competitors.
- Frame It as a Strategic Investment: Explain that this isn't just another marketing line item. It's an investment in brand reputation, future-proofing your market position, and protecting the ROI you get from all your other marketing channels.
When you can show leadership that your brand is already being discussed in these models—for better or for worse—the conversation quickly shifts from, "Should we do this?" to, "How fast can we get started?"
Ready to stop guessing and start measuring your brand's performance in AI search? PromptPosition gives you the clear, actionable data you need to see how you're represented in ChatGPT, Gemini, and more. Track your visibility, benchmark against competitors, and turn insights into action. Start optimizing your AI presence today by visiting https://www.promptposition.com.