How to Calculate Share of Voice in an AI-Driven World

To truly calculate share of voice, you must measure your brand’s visibility against the total possible visibility for your market. In the new landscape of AI search, this means tracking how often your brand gets mentioned in AI-generated answers compared to your competitors, all for a specific set of prompts. It’s the clearest way to see how present your brand is in this new conversational world and take action to improve it.
Why Share of Voice Is Your New North Star in AI Search
The battle for brand visibility has found a new frontier. For years, Share of Voice (SOV) was a straightforward metric tied to ad spend or search engine rankings. But now, with people turning to AI models like ChatGPT and Gemini for answers, the old rulebook is out the window. This is a brand new field in SEO, and understanding it is your first step to mastering it.
This shift is a fundamental change in how we must think about brand presence. Instead of just fighting for a spot on a SERP, we're now competing to be mentioned inside a trusted, AI-generated story. Being part of that conversation isn't a vanity metric—it's a direct line to customer awareness and consideration, driving tangible action.
Before we dive deep, let's get grounded in the core concepts that make up modern Share of Voice. This table is your quick reference guide to help you understand the landscape.
Quick Guide to Modern Share of Voice Concepts
| Concept | Definition | Why It Matters for AI |
|---|---|---|
| Mention | A direct reference to your brand, product, or service within an AI-generated response. | This is the fundamental unit of visibility. Unlike a link, a mention is an endorsement woven into a narrative. |
| Citation | The source or link an AI provides to back up its information. Often a direct link to a website. | Citations drive traffic and confer authority, acting as the AI's "proof" for its recommendation. |
| Sentiment | The tone (positive, neutral, negative) of the AI's mention of your brand. | A mention isn't enough; you need to know how you're being talked about to understand its true impact. |
| Share of Voice (SOV) | The percentage of total mentions your brand receives for a defined set of prompts versus your competitors. | This is the ultimate benchmark of your influence and visibility within the AI ecosystem. |
These terms form the new vocabulary for anyone serious about measuring their impact in the age of generative AI and driving real results.
The Shift from Rankings to Mentions
Moving from traditional search engines to conversational AI demands a new way of looking at visibility. It's less about a specific rank and much more about the quality and frequency of your brand’s appearance inside AI responses. This is a critical distinction that helps you focus on what really drives action.
Here’s why this new flavor of SOV is so critical:
- Influencing Decisions at the Source: When an AI model recommends your product, it feels like a trusted, third-party endorsement. That mention shapes a user's perception long before they ever click over to a website.
- Predicting Future Market Share: A strong presence in AI answers is a leading indicator of brand health and future growth. If you're dominating the conversation here, you're capturing mindshare where it now matters most.
- Gaining a Competitive Edge: Many companies are still stuck in a traditional SEO mindset. By moving quickly to measure and influence your SOV in AI, you can build a massive head start before this space gets crowded.
This new discipline is closely tied to what's known as Generative Engine Optimization, which is all about influencing AI outputs. To understand this new field better, our guide on what Generative Engine Optimization is is a great place to start.
The core idea is simple: if you’re not mentioned, you don’t exist. In the world of AI search, Share of Voice is the ultimate measure of existence. It quantifies your brand’s ability to break through the noise and become part of the answer, helping you drive action from awareness.
The Tangible Business Impact
Calculating and improving your AI Share of Voice isn't an abstract marketing exercise—it has a proven link to business growth. There's a well-established connection between a brand’s share of voice and its market share. Foundational research showed that brands achieving a 10% excess share of voice (ESOV)—where their SOV is 10 points higher than their market share—can expect an average 0.5% gain in market share annually. This principle makes SOV a powerful leading indicator for sales, turning visibility into measurable revenue.
That connection is even stronger in the AI era.
Imagine a potential customer asking an AI for "the best CRM for small businesses." If your brand consistently shows up in the top three recommendations, the impact on your leads and sales is immediate. Monitoring this with a purpose-built tool like PromptpPosition lets you see exactly where you stand and where you need to improve, giving you the clarity needed to act.
Ultimately, tracking SOV in AI search is about understanding and shaping the stories that drive customer decisions. It gives you a clear, data-driven roadmap for your content and PR strategies, ensuring your brand isn’t just visible, but is seen as an authority in the conversations that truly count.
Gathering the Right Data to Measure AI Visibility
Any good analysis starts with good data. To calculate your Share of Voice in AI, the quality of the prompts you track is everything. It's the classic "garbage in, garbage out" problem—a weak or biased set of prompts will give you a skewed picture of reality, preventing you from taking meaningful action.
The whole process hinges on building a strategic list of questions and phrases that mirror what your real-world audience is asking AI assistants. This isn't about throwing random queries at the wall; it's a methodical process that helps you understand your customer.
Building Your Core Prompt Set
First things first, you need to map out the conversational territory where your brand, your products, and your competitors exist. This means creating a structured list of prompts that covers key areas. A balanced list is the only way to get a complete, unbiased view of your visibility and find actionable insights.
Here’s a simple framework to help you get started:
Branded Queries: These are the softballs. Prompts that mention you by name, like "Is promptposition a good tool for AI analytics?" They're great for gauging how AI models see your brand's reputation and what they know about your specific features. This helps you understand your baseline.
Non-Branded, High-Intent Queries: This is where the real fight for attention happens. Think about problem-aware or solution-aware questions, such as "how to measure brand visibility in ChatGPT" or "best tools to track AI mentions." Showing up here means the AI sees you as an authority and a genuine solution, which is a massive win.
Competitor Queries: Don't forget to track prompts that name your direct rivals, like "What are the alternatives to [Competitor Brand]?" This is pure gold. It helps you spot opportunities to get mentioned as a better alternative, effectively siphoning off interest from your competition. This is where you can be proactive.
Start by brainstorming a few dozen prompts across these categories. Put yourself in your customer's shoes. What would they ask an AI to solve a problem your product fixes? Getting this list right is the most critical first step to driving action.
The Challenge of Scale and Consistency
You could start by manually plugging these prompts into different AI models, and for a quick spot-check, that's fine. But you’ll hit a wall almost immediately. AI responses are notoriously fickle; they change constantly based on model updates, conversational context, and even slight changes in phrasing.
The inconsistency is the single biggest roadblock to manual SOV tracking. What you see in a result today might be completely different from what a user in another country sees tomorrow. To get reliable data, you need consistency and scale that manual checks just can't deliver.
This is precisely why automated platforms are a necessity, not a luxury. A tool like our own, PromptPosition, is built to run hundreds or thousands of prompts across multiple LLMs on a set schedule. Automation strips out the randomness and gives you a stable, reliable dataset to analyze over time so you can make informed decisions.
For example, an automated system can produce a clear visualization of how you stack up against competitors, showing who's getting mentioned more or less frequently.
This kind of chart makes it instantly clear who's gaining momentum and who's falling behind—an insight that’s practically invisible when you're just doing sporadic manual checks. This clarity helps drive action.
Identifying and Tracking LLM Sources
Beyond just counting your brand mentions, you have to dig deeper and find out where the AI is getting its information. When an LLM cites a source—linking to an article, a review site, or a forum—it's handing you its playbook. These citations tell you exactly what content the model trusts.
Our guide on how to use AI for SEO digs into how this source-level insight can become a cornerstone of your content strategy.
By systematically tracking these sources, you can build a laser-focused digital PR and content plan. The goal is to get your brand featured on the specific pages the AI models are already referencing. It’s a much smarter way to influence the AI's narrative than just publishing content into the void and hoping it gets noticed. Make sure your data collection process is set up to capture and analyze these underlying sources from the start.
The Core Formulas for Calculating Share of Voice
Once you have your data pulled together, it’s time to get into the math. Don't worry, the core idea behind calculating Share of Voice is simple, but the real power comes from adapting classic formulas for the nuances of AI search. This is how you turn data into a plan.
Let's start with the traditional formula. It's the bedrock for understanding your brand's presence in any conversation.
(Your Brand Mentions / Total Market Mentions) x 100 = Share of Voice (%)
This equation gives you a straightforward percentage of the market conversation your brand owns compared to your competitors. While it's an old-school media metric, it’s more relevant than ever. The connection between SOV and real business growth is well-documented; for every 10% SOV you have above your actual market share, you can expect about a 0.5% bump in market share growth. This isn't just theory—it's a proven link, as detailed in research like this analysis on the predictive power of SOV from Talkwalker.
The whole data gathering process, from the prompts you choose to the sources the AI cites, feeds directly into these calculations.
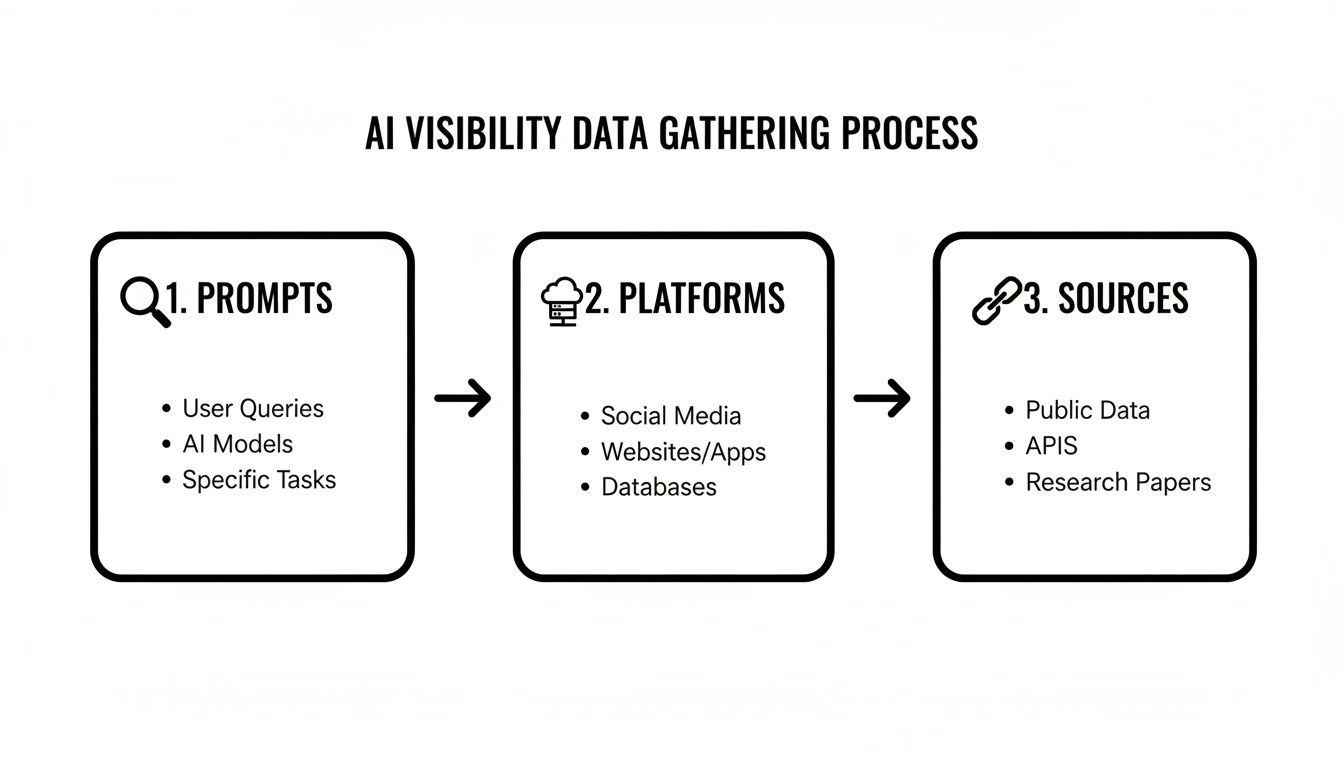
As you can see, getting the numbers right starts with a structured approach—strategic prompts leading to a clear picture of what's influencing the AI, which in turn helps you understand what actions to take.
A Worked Example of Basic SOV
Let's make this real. Imagine you're a project management software brand called "TaskFlow," and you're up against "ProjectPal" and "TeamSync." You decide to track 100 prompts related to 'best project management tools' over one month.
Here’s what you find:
- TaskFlow Mentions: 40
- ProjectPal Mentions: 75
- TeamSync Mentions: 35
- Total Market Mentions: 40 + 75 + 35 = 150
Plugging this into the formula, TaskFlow's SOV is (40 / 150) x 100 = 26.7%. Just like that, you have a solid benchmark for your visibility. But in the world of AI search, not all mentions carry the same weight, which leads us to more sophisticated, actionable models.
Introducing Weighted Share of Voice
A simple mention count is a great starting point, but it's missing critical context. A mention at the very top of an AI's answer is infinitely more valuable than one buried five paragraphs down. A weighted formula gives you a much more accurate picture by assigning a higher value to more prominent mentions.
The weighted formula looks like this:
Σ (Your Mentions x Weight) / Σ (Total Market Mentions x Weight) x 100
You get to define the weights. A simple but effective system could be:
- Top 3 Mentions: 3 points
- Mentions 4-6: 2 points
- Mentions 7+: 1 point
By applying weights, you shift the focus from if you were mentioned to how well you were mentioned. This prioritizes high-impact placements and gives a truer sense of your brand’s influence in AI-generated answers, helping you plan your next move.
Let's go back to our software example. What if, across those 100 prompts, TaskFlow appeared in the top 3 spots 15 times, while ProjectPal only managed it 10 times? This weighting would give TaskFlow’s SOV score a significant boost, reflecting its superior positioning even though it had fewer total mentions. This is where manually tracking becomes a nightmare and automated tools like promptposition become indispensable for tracking and applying these weights at scale.
Measuring Topical Share of Voice
Finally, it's crucial to look beyond general visibility. You need to know how authoritative your brand is on the specific topics that drive your business. Topical Share of Voice lets you zoom in on the niche conversations that matter most, helping you take targeted action.
Calculating this is simple: just filter your prompt set to a specific theme and run the same basic SOV formula. For our brand, "TaskFlow," we could break it down by different prompt categories:
- Prompts about 'collaboration features': This measures your authority on teamwork.
- Prompts about 'budgeting tools': This shows your visibility for financial planning features.
- Prompts comparing 'TaskFlow vs. ProjectPal': This reveals how you stack up in head-to-head queries.
This granular view helps you pinpoint exactly where your content and PR strategies are hitting the mark and where you're falling short. If your SOV for 'collaboration' is high but it's tanking for 'budgeting,' you know exactly where to aim your next content push to better inform the AI about your product's full capabilities. This is how you translate data into a concrete action plan.
Making Sense of the Numbers: Analyzing and Visualizing Your SOV Data

So, you've put in the hard work collecting and calculating your Share of Voice data. You're probably looking at a spreadsheet packed with numbers. That's a great start, but raw figures alone don't tell you the whole story.
The real magic happens when you bring that data to life. Turning numbers into visuals is how you spot trends, uncover competitor vulnerabilities, and pinpoint your next big opportunity. This is where you shift from just measuring things to making strategic decisions that drive action.
Building Your SOV Dashboard
Your first move should be to create a centralized dashboard. Think of it as your command center for AI visibility, putting all your most important metrics in one place. A well-built dashboard saves you from digging through spreadsheets and makes it incredibly easy to see what's changed, for better or worse.
The key is to resist the temptation to track everything. A cluttered dashboard is a useless one. Instead, focus on the metrics that directly inform your strategy and help you take action.
Here’s what I’d consider essential on any SOV dashboard:
- Overall SOV Trend: This is non-negotiable. A simple line chart tracking your SOV percentage over time (daily, weekly, or monthly) is the quickest way to see if your strategy is working.
- Competitive Benchmark: How do you stack up against the competition? A stacked bar chart or an area chart is perfect for visualizing your SOV next to your top two or three rivals.
- SOV by Prompt Category: Don't stop at the total number. You need to know where you're visible. A pie or bar chart that splits your SOV across branded, non-branded, and competitor queries reveals your blind spots and strong suits.
- Sentiment Analysis: If you're tracking sentiment, add a simple gauge or trend line showing the breakdown of positive, neutral, and negative mentions. A high SOV is great, but not if all the mentions are negative.
The best dashboards are built for storytelling. Anyone, from a specialist on your team to an executive in the C-suite, should be able to grasp your brand's position in the AI conversation in under 60 seconds and understand the next steps.
Essential SOV Metrics to Track in Your Dashboard
To help you build a dashboard that delivers real value, here's a breakdown of the core metrics you should be tracking. A good dashboard isn't just a data repository; it's a decision-making tool that provides a clear, comprehensive view of your brand's AI visibility and competitive standing.
| Metric | What It Measures | Actionable Insight |
|---|---|---|
| Overall SOV % | Your brand's total visibility across all tracked prompts over time. | Are our overall efforts increasing our presence? A rising trend validates recent campaigns. |
| Competitor SOV % | The visibility of your main competitors for the same set of prompts. | Who is gaining or losing ground? A competitor's spike could signal a new product launch or PR push. |
| SOV by Keyword Intent | Your visibility broken down by informational, navigational, and transactional queries. | Are we visible at the right stages of the buyer's journey? This helps align content with user intent. |
| Citation Quality Score | The authority and relevance of the sources citing your brand in AI answers. | Are we being mentioned by reputable sources? This adds a layer of qualitative analysis to the raw numbers. |
| Sentiment Trend | The percentage of positive, neutral, and negative mentions over time. | How is our brand perceived in AI-generated content? A shift to negative sentiment requires immediate PR attention. |
| New vs. Lost Mentions | The number of new mentions gained and existing mentions lost over a period. | Where are we gaining traction and where are we losing it? Helps identify decaying content or new opportunities. |
Tracking these metrics together gives you a multi-dimensional understanding of your performance, moving beyond a single percentage to a rich, actionable narrative.
Turning Data into Actionable Stories
Once your dashboard is live, you can start hunting for the stories hidden in the data. Visualization turns those abstract numbers into narratives that are impossible to ignore.
For example, that line chart showing your SOV climbing steadily over the last quarter? That’s not just data; it's proof that your recent content strategy is paying off. On the flip side, a sudden nosedive in your SOV while a competitor’s shoots up is an alarm bell—they’ve likely launched something you need to analyze and respond to, fast.
Automated tools like our own, PromptPosition, are designed to do exactly this. They handle the tedious data collection and visualization, presenting the information in a clean, intuitive way. This frees you up to focus on what really matters: analyzing the insights and shaping your strategy.
The whole point is to spend less time buried in spreadsheets and more time acting on what the data is telling you. An automated system makes it far easier to get buy-in from leadership by presenting clear, compelling KPIs that tell the story of your success.
Turning SOV Insights Into Strategic Action
Having a dashboard full of data is one thing; using it to outmaneuver your competition is another. Insight without action is just trivia. This is where your diligent work calculating Share of Voice pays off, turning raw numbers into marketing and content strategies that actually move the needle.
The data tells a story about your brand's presence in AI conversations. Is your SOV tanking for high-intent queries? That’s a clear signal your content isn't connecting. Did a competitor suddenly start dominating a topic where you were once strong? That's a direct challenge you need to meet, and fast.
Pinpointing Content Gaps and Opportunities
Think of your SOV analysis as your new content roadmap. By slicing the data by topic or keyword intent, you can see exactly where your narrative is weak and where your competitors are leaving the door wide open. This helps you prioritize your actions.
Low SOV for High-Intent Queries: If you're basically invisible in prompts like "best software for…" or "how to solve [problem]," this is a code-red situation. This insight gives your content team a direct mandate: create definitive, high-authority articles, case studies, and guides that squarely answer those questions.
Competitor Dominance on a Key Topic: See a rival sitting on a 90% SOV for a topic you want to own? Don't try to go head-to-head right away. Instead, look for a niche angle they're ignoring. Create content that addresses a more specific sub-topic or a different user persona. This lets you build a foothold before you try to take the hill.
The goal here is to shift from reactive content creation to a proactive strategy guided by hard data. Every piece you produce should be designed to fill a specific, identified SOV gap.
Targeting the Sources That Influence AI
One of the most powerful actions you can take is to go after the underlying sources that LLMs rely on. When you track citations, you're essentially getting a direct look inside the AI's "brain." Instead of just publishing content and crossing your fingers, you can run a precision-strike digital PR and link-building campaign.
Your SOV data literally hands you a target list of websites. If an AI model consistently cites a specific industry blog or review site when answering questions about your market, getting your brand featured there becomes a top priority. It's the most direct path to influencing the AI's future responses.
This approach transforms your outreach from a guessing game into a data-driven mission. You're no longer just "building links"—you're strategically placing your brand within the AI's trusted information ecosystem. This is a core part of advanced AI search engine optimization, a discipline focused on shaping these new conversational results.
Building a Proactive Defense and Offense
Monitoring SOV continuously allows you to play both defense and offense effectively. When you have a real-time view of the conversational landscape, you can respond to changes with agility instead of being caught flat-footed months later.
This constant pulse-check is vital because Share of Voice has evolved far beyond simple ad spend ratios. It's now a critical multi-channel metric that directly links visibility in the AI era to gains in market share. For example, one brand’s 92% gain in Amazon SOV led to a 63% boost in conversions, while another saw a 42% increase in share of search, which helped drive a 17% lift in ROAS. With conversational AI expected to handle 70% of customer interactions by 2027, proactively tracking SOV is how leading brands secure their future. You can see more about how digital-era brands are growing with these insights on 10xcrew.com.
Using a tool like promptposition automates this entire process, sending you alerts when a competitor makes a move or when your own visibility drops unexpectedly. This lets you take action immediately:
- Defend Your Position: Instantly see if a competitor starts showing up for your branded terms or launches a campaign that chips away at your SOV, letting you mount a quick counter-strategy.
- Seize Opportunities: Identify when a competitor's visibility falters on a key topic, creating an opening for you to swoop in with targeted content and claim that conversational territory.
Ultimately, turning SOV data into action is all about creating a feedback loop. You measure, you analyze, you act, and then you measure again to see the impact. This agile, data-informed cycle is what separates the brands that merely exist from those that dominate the conversations shaping their industry.
Common Questions About AI Share of Voice
As you start digging into a new metric like AI Share of Voice, practical questions always follow. Moving from "what" to "how" inevitably brings specific challenges. This section is all about answering those real-world questions to help you understand what to do next.
Think of this as your field guide for getting started. We'll cover the big ones, like how many prompts to track and how often you should be checking in on your performance.
How Many Prompts Should I Actually Track?
This is always one of the first questions, and the honest answer is, it depends on your market and your budget. That said, more data is almost always better for getting an accurate picture. A small startup might get by with a focused list of 50-100 core prompts, whereas a large enterprise in a crowded space could easily be tracking thousands.
If you're looking for a solid starting point to take action, make sure you have good coverage in these areas:
- Your Core Commercial Keywords: Start with at least 20-30 of your most important non-branded, solution-focused queries. These are the terms people use when they have a problem you can solve.
- Competitor Battlegrounds: Add another 15-20 prompts that directly compare you to your main rivals (e.g., "Brand X vs. Brand Y").
- Brand Health: A smaller set of 10-15 branded prompts is smart for keeping an eye on your own reputation and how you're being described.
The real goal isn't just a big number; it's a representative sample. A well-chosen list of 100 prompts will give you far more insight than 1,000 random ones. Tools like promptposition are built for this, helping you discover relevant prompts based on your industry so your tracking is strategic right from the start.
How Often Should I Measure My SOV?
The right cadence really depends on two things: how fast your market moves and how actively you're trying to influence the results. For most brands, checking in weekly strikes the perfect balance.
Here’s how I think about measurement frequency to guide your actions:
- Daily: This is for crunch time. Think major campaigns, a new product launch, or during a PR crisis. Daily checks let you see what’s happening in near real-time and react quickly.
- Weekly: This is the sweet spot for most businesses. It’s frequent enough to spot important trends and see what competitors are up to without getting bogged down in meaningless daily fluctuations.
- Monthly: Perfect for high-level strategy and reporting up to leadership. Looking at the data monthly smooths out the noise and clearly shows your long-term progress.
The most important thing is consistency. Whatever rhythm you choose, stick with it. Consistent measurement is the only way you’ll build a reliable trendline that proves whether your strategies are actually working.
What Is a "Good" Share of Voice Percentage, Anyway?
There's no magic number here. A "good" SOV is completely relative to your competitive landscape. In a fragmented market with dozens of players, hitting a 15% SOV could make you the undisputed leader. But if you're in an industry dominated by two behemoths, you might need 40% SOV just to be in the game.
Instead of fixating on a universal number, focus on these actionable benchmarks instead:
- Beat Your Direct Competitors: Your first goal should be to consistently have a higher SOV than your top one or two rivals on the prompts that drive your business.
- Achieve "Excess Share of Voice" (ESOV): This is a classic marketing principle. You want your SOV to be higher than your actual market share. It’s a powerful leading indicator of future growth.
- Show Consistent Growth: Honestly, a "good" SOV is one that's trending up. If you can show steady month-over-month improvement because of your content and PR efforts, you're winning.
Context is everything. The first step is to get a baseline—measure where you and your key competitors stand today. That initial data gives you the reality check you need to set ambitious but achievable goals for your team and take informed action.
Ready to stop guessing and start measuring your brand's true visibility in AI search? promptposition gives you the data-driven insights you need to understand your AI Share of Voice, benchmark against competitors, and build a winning strategy. Get your free demo today and see what the AI is saying about you.