Benchmarking in Marketing: A 2026 Guide to Growth and Visibility

In marketing, benchmarking is simply the process of measuring your performance against a meaningful standard. Think of it like a report card for your business. It doesn't just show you your own grade; it shows you how you stack up against the top performers and, just as importantly, your own past results. This context is what turns a pile of data into a clear path forward, helping you understand where to focus your efforts and drive meaningful action.
Why Your Marketing Metrics Might Be Lying to You

Here’s a story I’ve seen play out a hundred times: Your social media engagement is through the roof, website traffic is climbing, and the campaign reports look fantastic. But when the time comes to connect that activity to actual business growth, the numbers suddenly feel a lot less certain.
This is a classic trap, a 'marketing data mirage,' where teams get busy chasing metrics that look great on a dashboard but don't move the needle on revenue. This is exactly where benchmarking in marketing becomes your reality check. It pushes you to ask the hard questions. Is our 15% traffic increase really a win if our competitors grew by 30%? Is a sky-high click-through rate worth anything if none of those clicks ever turn into customers?
The Growing Credibility Gap in Marketing Data
Honestly, the industry has a credibility problem. Recent studies show a staggering 87% of organizations believe their marketing investments are generating unreliable signals. It gets worse. 66% of leaders admit their campaign metrics often look successful on the surface but fail to drive real revenue. This is the marketing data mirage in action. You can dig into the specifics in the 2026 State of Performance Marketing report.
Without the right context, even your best-looking numbers can be misleading. A huge part of the solution is simply knowing what to measure, because learning how to properly track your SEO performance is the first step toward getting accurate insights.
Benchmarking shifts your perspective from asking, "How did we do?" to "How are we doing compared to what's truly possible?" It's the difference between celebrating a new personal record in a marathon and then realizing you still finished in the bottom half of all runners.
To get out of this data trap, you have to learn to distinguish between metrics that feel good and those that do good. This means focusing less on superficial "vanity metrics" and more on impactful benchmarks tied directly to your business goals.
Vanity Metrics vs. Impactful Benchmarks
It's easy to get distracted by numbers that are easy to measure but hard to connect to business outcomes. Here's a quick reference table to help you spot the difference between superficial data and the metrics that truly matter.
| Metric Type | Example | Why It's Deceiving | Better Benchmark Alternative |
|---|---|---|---|
| Vanity Metric | Social Media Likes | High likes don't guarantee engagement or customer loyalty. They are passive and often bought. | Share of Voice (SOV): Measures your brand's visibility vs. competitors, showing market penetration. |
| Vanity Metric | Website Pageviews | More traffic is good, but it doesn't tell you if the right people are visiting or what they do next. | Conversion Rate: Tracks the percentage of visitors who complete a desired action (e.g., sign up, purchase). |
| Vanity Metric | Email Open Rate | An 'open' can be triggered by a server without a human ever seeing the email. It's an unreliable signal. | Click-to-Open Rate (CTOR): Shows how many of the people who opened the email actually engaged with the content. |
| Vanity Metric | Keyword Rankings | Ranking #1 for a term with no search volume or buyer intent doesn't drive business results. | Organic Search Visibility: Measures your overall presence across a portfolio of valuable keywords. |
Shifting your focus to the "Better Benchmark" column is how you start proving marketing's real contribution.
For instance, instead of just counting likes, you could start tracking Share of Voice, which gives you a much clearer picture of your brand's authority in the market. These types of search metrics offer clearer visibility into your true standing.
This isn't just a suggestion anymore—it's becoming essential for survival. By 2026, comparing your performance against your own history and your top rivals will be the default for any high-performing team looking to justify its budget and prove its worth.
Understanding the Different Types of Benchmarking
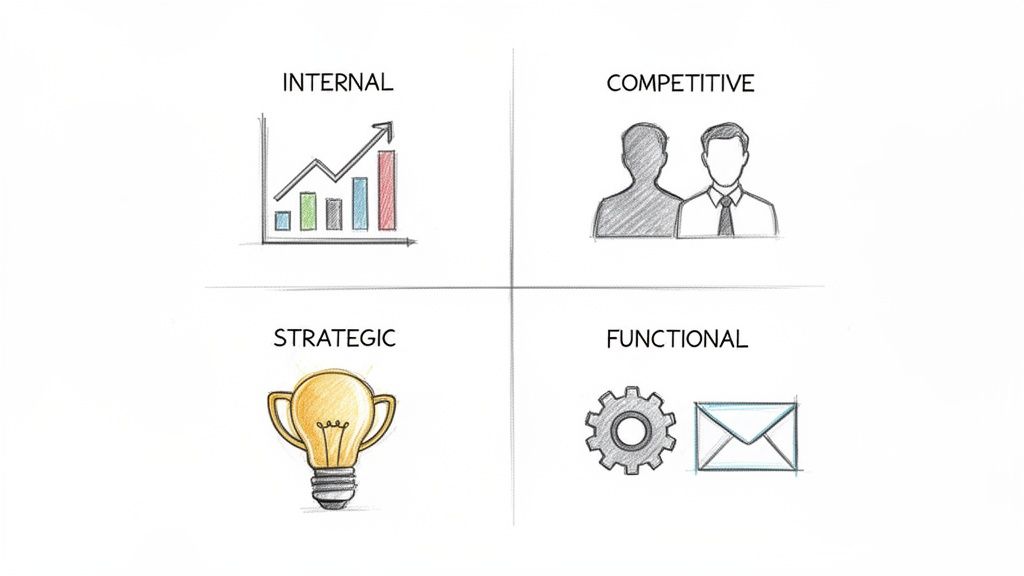
To really get the most out of benchmarking, you first need to know it’s not a one-size-fits-all deal. Think of it as a complete toolkit, not just a single wrench. Each type of benchmarking gives you a different angle for looking at your performance, providing the exact context you need to make smarter moves.
This isn’t about just blindly copying your rivals. It's about systematically gathering intelligence to pinpoint where you can genuinely improve. The four main types of benchmarking work together to paint a full picture of where your marketing stands.
Internal Benchmarking
The best place to start is often right in your own backyard. Internal benchmarking is all about looking inward and measuring your current performance against your own past results. It’s a lot like a runner trying to beat their personal best.
The core question you're asking is simple: "Are we getting better?" For instance, you could compare this quarter's Cost Per Lead (CPL) to the last four quarters. If that number is consistently dropping, you know your efficiency is improving. A sudden jump, on the other hand, is a red flag that something needs a closer look.
This type is your foundation. Without a solid grasp of your own trends, any comparisons to the outside world won’t mean much.
Competitive Benchmarking
This is what pops into most marketers' heads when they hear the word "benchmarking." With competitive benchmarking, you're directly comparing your key metrics against your direct competitors. The goal is to figure out where you're winning, where you’re falling behind, and what your true market position is.
Let's say a B2B SaaS company finds out its marketing spend is 8% of ARR, which happens to be the industry median. That sounds okay, right? But if they discover their faster-growing competitors are spending 40% more, that insight suddenly reframes their entire budget and growth strategy.
Competitive benchmarking answers the question, "How are we doing against the people we fight for business with every single day?" It’s about knowing your position on the field, not just how fast you can run.
Here, you might analyze metrics like share of voice, website traffic, social media engagement, or even how prominently your brand appears in AI chat responses. This outside-in view is absolutely critical for staying relevant and spotting competitive threats before they become full-blown problems.
Strategic Benchmarking
Sometimes, the most brilliant ideas come from looking way outside your own industry. That's where strategic benchmarking comes in. It’s the art of studying high-performing companies in completely different sectors to learn from their world-class processes.
A local gym, for example, has little in common with Starbucks. But they could learn a ton by studying how Starbucks masters customer loyalty. Or they could look at how Amazon has perfected its streamlined checkout flow. You're not comparing apples-to-apples metrics; you're adapting game-changing strategies and principles to your own world. It’s a fantastic way to spark creativity and drive real innovation.
Functional Benchmarking
While strategic benchmarking looks at the big picture, functional benchmarking zooms in on a specific business activity. It involves comparing the performance of a single function—like your email marketing, customer onboarding, or content distribution—against the best-in-class examples, no matter the industry.
For instance, your team might be seeing an email campaign Click-Through Rate (CTR) of 0.90%. By looking at functional benchmarks, you might find the average for the legal industry is 1.61%, showing you there's significant room to grow. Similarly, understanding how metrics like brand sentiment are measured can give your PR and content teams a powerful benchmark to aim for.
This highly focused approach helps you quickly spot operational weak spots and borrow proven tactics to shore them up.
Choosing Marketing KPIs That Actually Matter
It’s easy to get lost in a sea of data. When you’re trying to benchmark your performance, the temptation is to track every metric you can get your hands on. But measuring everything is the same as measuring nothing.
Effective benchmarking isn't about drowning in dozens of metrics. It's about hand-picking the few Key Performance Indicators (KPIs) that tie directly back to your most important business goals. This is how you stop reporting on marketing activity and start telling a powerful story about marketing impact.
Think of a good KPI as a compass, not just a speedometer. It doesn't just tell you how fast you're going; it tells you if you're headed in the right direction. The key is to focus on the most critical stages of your customer's journey, from the first moment of awareness to the final sale.
KPIs for Brand Awareness and Reach
Before anyone can buy from you, they have to know you exist. This is the very top of your marketing funnel, where the name of the game is visibility and owning a piece of your audience's mind. Don't just count impressions—focus on metrics that actually gauge your influence in the market.
A fantastic KPI for this is Share of Voice (SOV). This metric benchmarks your brand's visibility against your direct competitors across all the channels that matter. Are you getting mentioned more in industry articles? Are you showing up more often in search results or—increasingly important—in AI-powered answers? Tracking your SOV tells you whether you're just another voice in the crowd or on your way to dominating the conversation.
To dig deeper, you can learn how to measure and grow your Share of Voice in our guide.
Benchmarking Your Lead Generation Engine
Okay, so you've got their attention. Now what? The next step is to convert that awareness into real, tangible interest. For this, you need KPIs that measure both the efficiency and the quality of your lead generation. Simply counting leads is a classic rookie mistake; quality will always trump quantity.
The metric that truly matters here is Cost Per Qualified Lead (CPQL). This goes a step beyond the basic Cost Per Lead (CPL) by focusing only on leads who meet your specific criteria—the ones your sales team is actually excited to talk to. Benchmarking your CPQL against industry averages or your own past performance shows you how well you're attracting the right people.
If your CPQL is trending down, that’s a great sign your targeting and messaging are getting sharper. If it suddenly jumps up, consider it an early warning that a campaign is attracting the wrong crowd or your channel costs are getting out of hand.
Measuring Customer Conversion and Cost
This is where the rubber meets the road—where your marketing spend turns into actual revenue. Your conversion KPIs need to tell you not just how many customers you're winning, but exactly what it cost you to win them. This is how you draw a straight line from marketing budget to business value.
The gold standard KPI here is Customer Acquisition Cost (CAC). It's a simple calculation: your total sales and marketing costs divided by the number of new customers acquired over a set period. Benchmarking your CAC against the Lifetime Value (LTV) of a customer is one of the most critical health checks for any business. For a sustainable business, your LTV must be significantly higher than your CAC.
Setting the Right KPIs for Each Channel
Your digital presence isn't one big monolith. It’s a collection of unique channels, each with its own audience, its own culture, and its own rules. That means you can't use a one-size-fits-all approach to benchmarking. A "good" click-through rate on one platform might be abysmal on another.
For instance, comparing email engagement to SMS is like comparing apples to oranges. Recent data shows that global email click-through rates have dipped to 3.7% as people scan their inboxes without clicking. Meanwhile, SMS hits an average click-through rate of 25.7%, and WhatsApp blows both away at a staggering 51%. You can explore more of these latest marketing statistics on HubSpot.
These numbers make it crystal clear: you need separate benchmarks for each platform. By setting realistic, channel-specific goals for metrics like engagement rate, click-through rate, and conversions, you can get a true read on what's working and pour your resources into the channels that deliver real results.
Your Step-By-Step Marketing Benchmarking Framework
Knowing you should benchmark and actually doing it are two very different things. It’s easy to get stuck right at the starting line, overwhelmed by the idea of it all. The trick is to have a structured plan that breaks the process down into simple, manageable steps.
Think of it like putting together a complex piece of furniture. You wouldn't just start screwing pieces together randomly. You need a set of instructions—a blueprint—to guide you from start to finish. Here is that blueprint for building your own marketing benchmarking program.
Step 1: Define Your Goals and Scope
Before you even think about metrics, you have to ask yourself one critical question: What problem am I trying to solve? A clear goal is the difference between a one-off report that gets forgotten and a program that actually drives meaningful change.
Are you trying to make a case for a bigger budget? Do you need a clearer picture of your standing in the market? Or maybe you're just trying to figure out if your email marketing is as efficient as it could be? Your goal will steer the entire project.
Get specific. A vague goal like "improve social media" won't get you anywhere. Instead, aim for something sharp and focused, like, "Determine if our Facebook ad spend is efficient compared to key B2B competitors."
Step 2: Select Your Key Metrics
Once you have a solid goal, choosing the right Key Performance Indicators (KPIs) becomes much easier. The metrics you track must tie directly back to the question you’re trying to answer. As we've covered, chasing vanity metrics is a dead end. You need KPIs that signal real business impact.
For instance, if your goal is to measure competitive brand awareness, your go-to metric will be Share of Voice (SOV). If you’re trying to evaluate how efficiently you’re generating leads, you'll be laser-focused on Cost Per Qualified Lead (CPQL).
This flow diagram gives you a good look at how different metrics map to the marketing funnel.
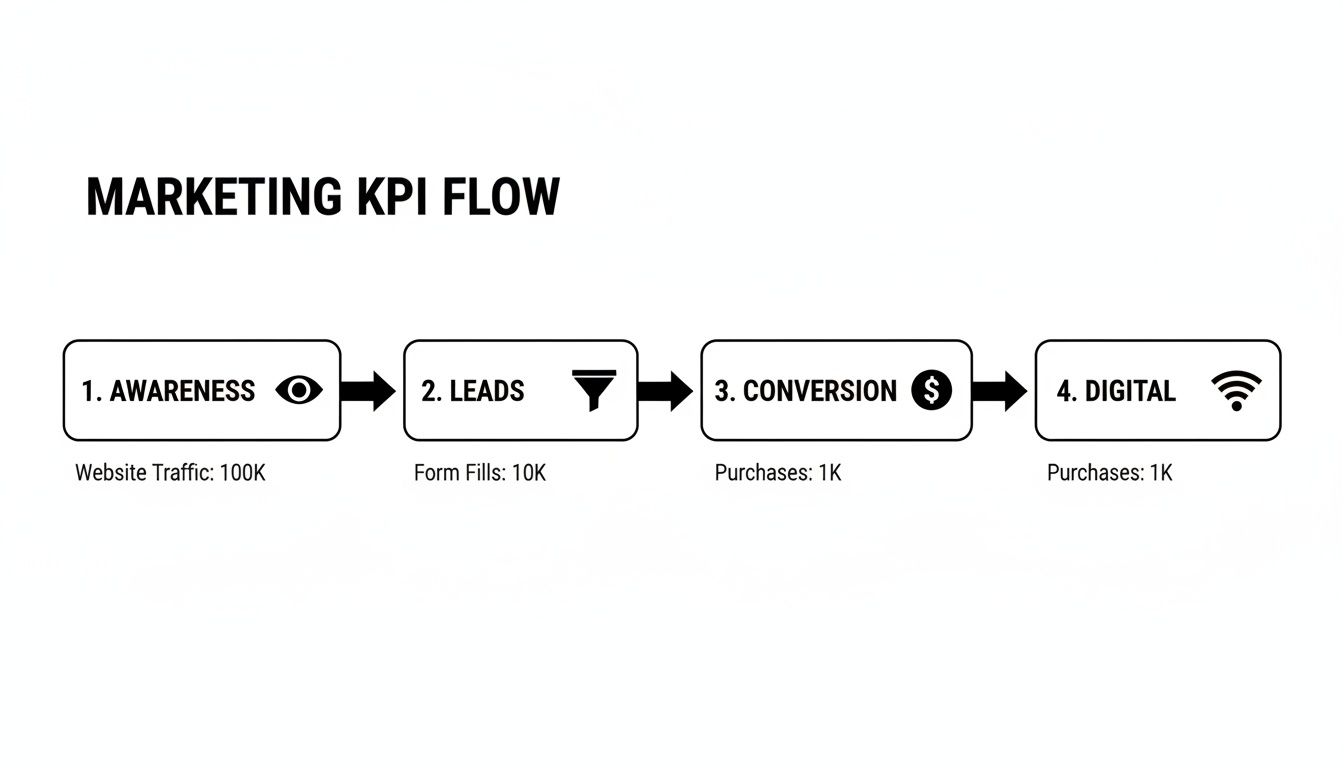
As you can see, the right KPI depends entirely on which stage of the customer journey you’re trying to improve.
Step 3: Identify Your Comparison Group
Your performance data doesn't mean much in a vacuum. You need a benchmark—a "cohort"—to measure it against. This is the group that provides the context for your numbers.
You have a few options here:
- Internal Benchmarking: Compare your current performance against your own past results (e.g., this quarter vs. last quarter). This is great for tracking internal progress.
- Competitive Benchmarking: Put your numbers up against a few direct rivals. This is absolutely essential for understanding your position in the market.
- Industry Benchmarking: See how your metrics stack up against published industry averages. This gives you a broader sense of where you stand.
- Strategic Benchmarking: Look at top performers, even those outside your industry, to spark new ideas and find innovative strategies.
For your first benchmarking project, I’d recommend focusing on 2-3 direct competitors. It’s the most insightful and manageable place to start.
Step 4: Gather the Right Data
Alright, it’s time to roll up your sleeves and collect the data. This can be the most time-consuming part of the process, but the right tools make a world of difference. The data you need will depend entirely on the KPIs you chose in Step 2.
For your own numbers, you’ll pull from your internal systems—Google Analytics, your CRM, and your marketing automation platform. For external data on your competitors, you'll need specialized tools. A platform like SEMrush is a workhorse for SEO and PPC metrics, while a tool like promptposition is built specifically for benchmarking your visibility in AI search.
The best benchmarking programs pull from multiple data sources to build a complete picture. If you rely on just one tool, you're almost guaranteed to have blind spots.
Step 5: Analyze Gaps and Find Opportunities
With all your data in hand, the real analysis begins. Lay out your performance next to your benchmark and start looking for the gaps. Where are you knocking it out of the park? And where are you falling behind?
But don't just stop at identifying weaknesses. The most important question to ask is why. If a competitor has a significantly lower Cost Per Click, dig into their ad copy, creative, and landing pages. If they seem to own the conversation in AI answers, look at what sources the models are citing. Every gap, positive or negative, is a chance to learn something new.
Step 6: Implement Changes and Track Progress
Finally, you have to close the loop. An insight is worthless until you act on it. Use your analysis to create a concrete action plan with clear, prioritized tasks.
Assign ownership for each item and set a realistic timeline for getting it done. And here’s the most important part: benchmarking isn't a one-and-done project. You have to keep monitoring your KPIs to see if your changes are actually moving the needle. This creates a powerful cycle of measurement, analysis, and improvement that will steadily lift your marketing performance over time.
The New Frontier: Benchmarking for AI Search
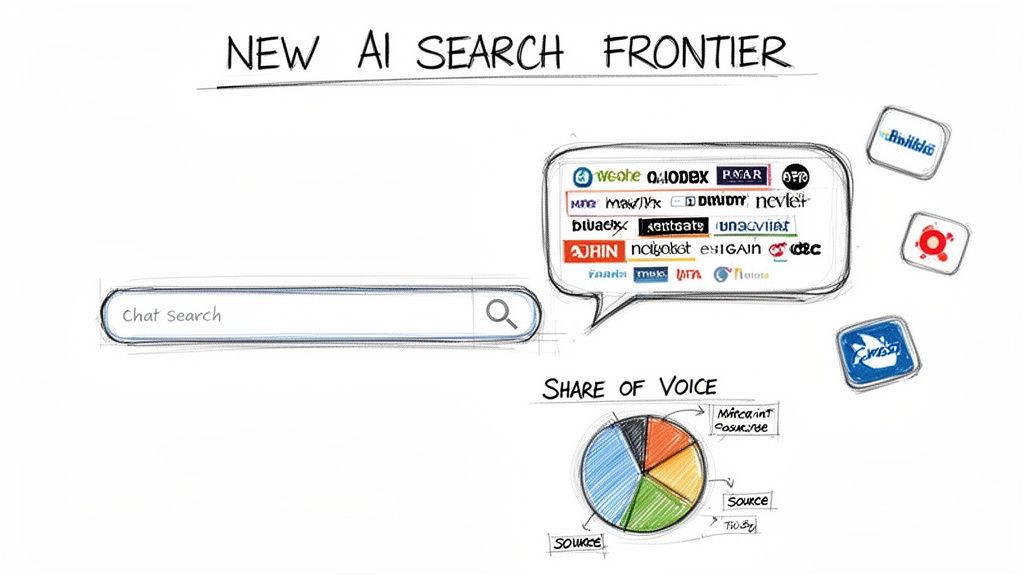
For decades, marketers have lived and breathed keyword rankings on Google. But the ground is shifting right under our feet. A completely new field has emerged that demands our attention: AI-generated answers from models like ChatGPT, Gemini, and Claude. This is not just a new channel; it’s a new frontier for SEO and digital marketing.
This is the next evolution in benchmarking in marketing. We're moving beyond optimizing for a list of blue links and into a world where we must measure our brand's visibility inside AI conversations. Earning a mention in a ChatGPT answer is the modern equivalent of a feature in a major publication—it’s a trusted placement that can fundamentally shape how customers see you.
The challenge? This new field often feels like a "black box," making it incredibly difficult to know if you're winning or losing. How can you tell if an AI model is recommending your product or sending prospects to a competitor? This is where a new kind of analytics for AI search becomes absolutely essential to understand and act upon.
Why You Can't Afford to Ignore AI Search
Generative AI is on everyone's mind, but most companies are playing catch-up. A McKinsey report revealed that only 6% of European companies feel they are truly mature in their use of generative AI. For savvy marketers, this gap isn't a problem; it's a massive opportunity to get ahead of the curve.
As more of your customers turn to AI assistants for quick answers and product suggestions, your absence becomes a glaring hole in your marketing funnel. If you aren't benchmarking your performance on these platforms, you're flying blind through what is quickly becoming a primary channel for discovery and decision-making.
Just as SEO became non-negotiable for organic search visibility, measuring your presence in AI answers is now a critical part of any modern marketing strategy. Not tracking it is like running a TV ad campaign without knowing which channels are airing your commercials or what they're saying about you.
New KPIs for a New Channel
Your old metrics just won't cut it here. To properly benchmark your performance in this new field of SEO, you need to start tracking a new set of KPIs built specifically for Large Language Models (LLMs). These metrics help you finally put a number on your presence and get a clear, actionable picture of how you're perceived.
Share of Voice in AI: This is the big one. It measures how often your brand is mentioned in AI responses for key prompts compared to your competitors. It's the direct successor to share of voice in traditional search.
Brand Sentiment Analysis: A high share of voice is fantastic, but not if the AI is saying negative things about you. This KPI analyzes whether the mentions of your brand are positive, negative, or neutral.
Source Attribution Tracking: This is where the real gold is. It identifies which of your web pages, blog posts, or press releases are being cited by the AI models. It tells you exactly what content is successfully influencing the AI's "brain."
Trying to track these metrics by hand is next to impossible. AI responses are dynamic, personalized, and often unpredictable. That’s why specialized tools are becoming indispensable for serious marketers. Platforms like PromptPosition are designed to monitor these new KPIs, turning the opaque world of AI answers into a clear, measurable marketing channel that drives action. You can learn more about AI search visibility in our dedicated article.
As you step into this new arena, a deep understanding of AI-driven marketing insights will be crucial for maintaining a competitive edge.
Putting AI Benchmarking into Practice
Let's make this real. Imagine you're the marketing manager for a project management software. You could use a tool to track important customer prompts like "best project management tool for small teams" or "Asana vs. Monday." The platform would then give you a clear report on who is winning the share of voice for those high-intent queries.
A dashboard like this instantly shows you where you're visible and, more importantly, where your competitors have an edge. These insights allow you to focus your content strategy and PR efforts with surgical precision.
By benchmarking your presence in AI search, you're not just adding another metric to a spreadsheet. You're building a powerful competitive advantage in a vital new channel—long before your rivals even know the game has started.
Your Action Plan: Start Your First Benchmarking Project
Alright, you've seen what benchmarking is and why it matters. But theory is one thing—putting it into practice is another. It's easy to look at all the data and possibilities and feel a little paralyzed. The secret is to start with a clear, focused action plan.
The secret? Don't try to boil the ocean.
Think of it like starting a new workout plan. You wouldn't just walk into a gym and try to lift the heaviest weights, right? Of course not. You’d start with a simple, manageable routine, get a feel for the movements, and build strength over time. Your first benchmarking project should work the same way. Start with a quick win to build momentum and drive action.
The most successful benchmarking programs I’ve seen didn’t start with a massive, company-wide audit. They began with a single, smart question that could be answered with a focused effort. That’s how you prove the value and get everyone else on board.
Pick a Fight You Can Win
The goal here is to move from theory to action, quickly. A great first project is tightly focused on an area where you can find a clear, actionable insight. This way, you learn the ropes without getting tangled in too much complexity.
Here are two fantastic ideas for a first project:
Project Idea 1: The Competitive Content Heist. Your mission is simple: find out what topics your competitors are ranking for in search that you're completely missing. Use an SEO tool to pull the top keywords for two of your main rivals. Compare their lists to yours, find the juicy, high-value terms you haven't targeted, and then create a content plan to start stealing some of that traffic.
Project Idea 2: The AI Brand Check-Up. This is a perfect, forward-thinking project for the new world of generative AI. The goal is to see how AI chatbots like ChatGPT talk about your brand compared to your competition. Using a tool like PromptPosition, you can track how your brand is portrayed for a few critical prompts (e.g., "best project management tool for remote teams") and see who's getting the most positive recommendations.
Both of these projects stand on their own, deliver clear results you can act on immediately, and perfectly illustrate the power of looking beyond your own metrics.
Your First-Project Game Plan
To keep things simple and on track, just follow this checklist. It covers all the bases without getting you lost in the weeds.
- Set ONE Clear Goal: Write down the single question you want to answer. For example: "Which of our top two competitors is getting more positive mentions in AI chat results?"
- Define Your Arena: Choose who you're up against (e.g., Competitor A and Competitor B) and what you'll measure (e.g., number of positive mentions vs. negative mentions).
- Gather the Intel: Use the right tool for the job. That might be your SEO platform for a content gap analysis or an AI analytics tool like PromptPosition for the brand check-up.
- Spot the Gaps: A simple spreadsheet is your best friend here. Lay out the data and find the differences. Where are they showing up that you aren't? What are they doing better?
- Find ONE Actionable Insight: Don't get overwhelmed trying to fix everything at once. Find one clear opportunity. For instance: "Competitor A is always mentioned for their detailed case studies; we need to publish more of our own."
- Share the Win: Create a quick summary of what you found and what you recommend doing about it. This simple report is how you start building a real culture of benchmarking.
Starting small isn't a shortcut; it's a strategy. When you deliver a quick, tangible win, you generate the excitement and buy-in you need to make benchmarking a core part of how your team grows.
Common Questions About Marketing Benchmarking
As you start thinking about benchmarking, you're bound to have some questions. It's a big topic! Here are some straightforward answers to the most common things marketers ask.
What Makes a Good Benchmark?
A truly good benchmark has three key ingredients: it’s relevant, attainable, and actionable.
Think of it this way: if you're a B2B software company, comparing your email open rates to a fast-fashion brand is pointless. That’s an irrelevant benchmark. But comparing your rates to the B2B software industry average? Now that is relevant. It gives you context you can actually use.
The best benchmarks are realistic enough to aim for (attainable) and give you clear insights you can immediately act on to improve (actionable).
How Often Should I Benchmark?
There's no single right answer here—it really depends on what you’re measuring.
Quarterly: This is a solid rhythm for your big-picture metrics like Customer Acquisition Cost (CAC) and Share of Voice (SOV). It's frequent enough to catch important trends without getting bogged down in tiny, meaningless fluctuations.
Monthly: This works perfectly for channel-specific metrics, like your website's conversion rate or social media engagement. Looking at these numbers monthly allows you to make smart, tactical adjustments to your day-to-day marketing.
Weekly or Real-Time: Save this for your fastest-moving campaign metrics. Think ad spend, click-through rates, and especially your brand's visibility in AI search results, which can literally change overnight.
Is It a Bad Sign if My Numbers Are Below the Benchmark?
Not at all. In fact, uncovering areas where you're behind is one of the most valuable outcomes of benchmarking in marketing.
Finding out you’re lagging behind the industry standard isn’t a failure; it’s an opportunity. It provides a clear, data-backed reason to shift your strategy, fight for more resources, or focus your team's efforts on closing a specific gap.
Don’t look at a below-average metric like a bad report card. See it as a map that shows you exactly where you can make the most impactful improvements.
Can I Benchmark My Brand’s Visibility in AI?
Yes, and honestly, you can't afford not to. Measuring how your brand shows up in AI-generated answers on platforms like ChatGPT and Gemini is the new frontier of SEO. For years we've tracked keywords on Google; now we have to track how often our brand is mentioned—and in what context—when customers ask AI for recommendations.
This isn't something you can easily do by hand, so specialized tools are a must. A platform like promptposition is built for this. It automates the tracking of critical KPIs like AI Share of Voice and sentiment, giving you a clear report card on your performance in this vital new channel. It takes the "black box" of AI responses and makes it a measurable part of your strategy, helping you spot and fix visibility problems before your competitors even know they exist.
Ready to stop guessing and start measuring your impact in AI search? With promptposition, you can benchmark your brand's visibility, sentiment, and competitive standing across all major AI models. Get the data you need to win in this new era of discovery. Find out where you stand in AI today.